
Location Analysis Data Product
Product Design, Web & Mobile
ImmoScout24
About
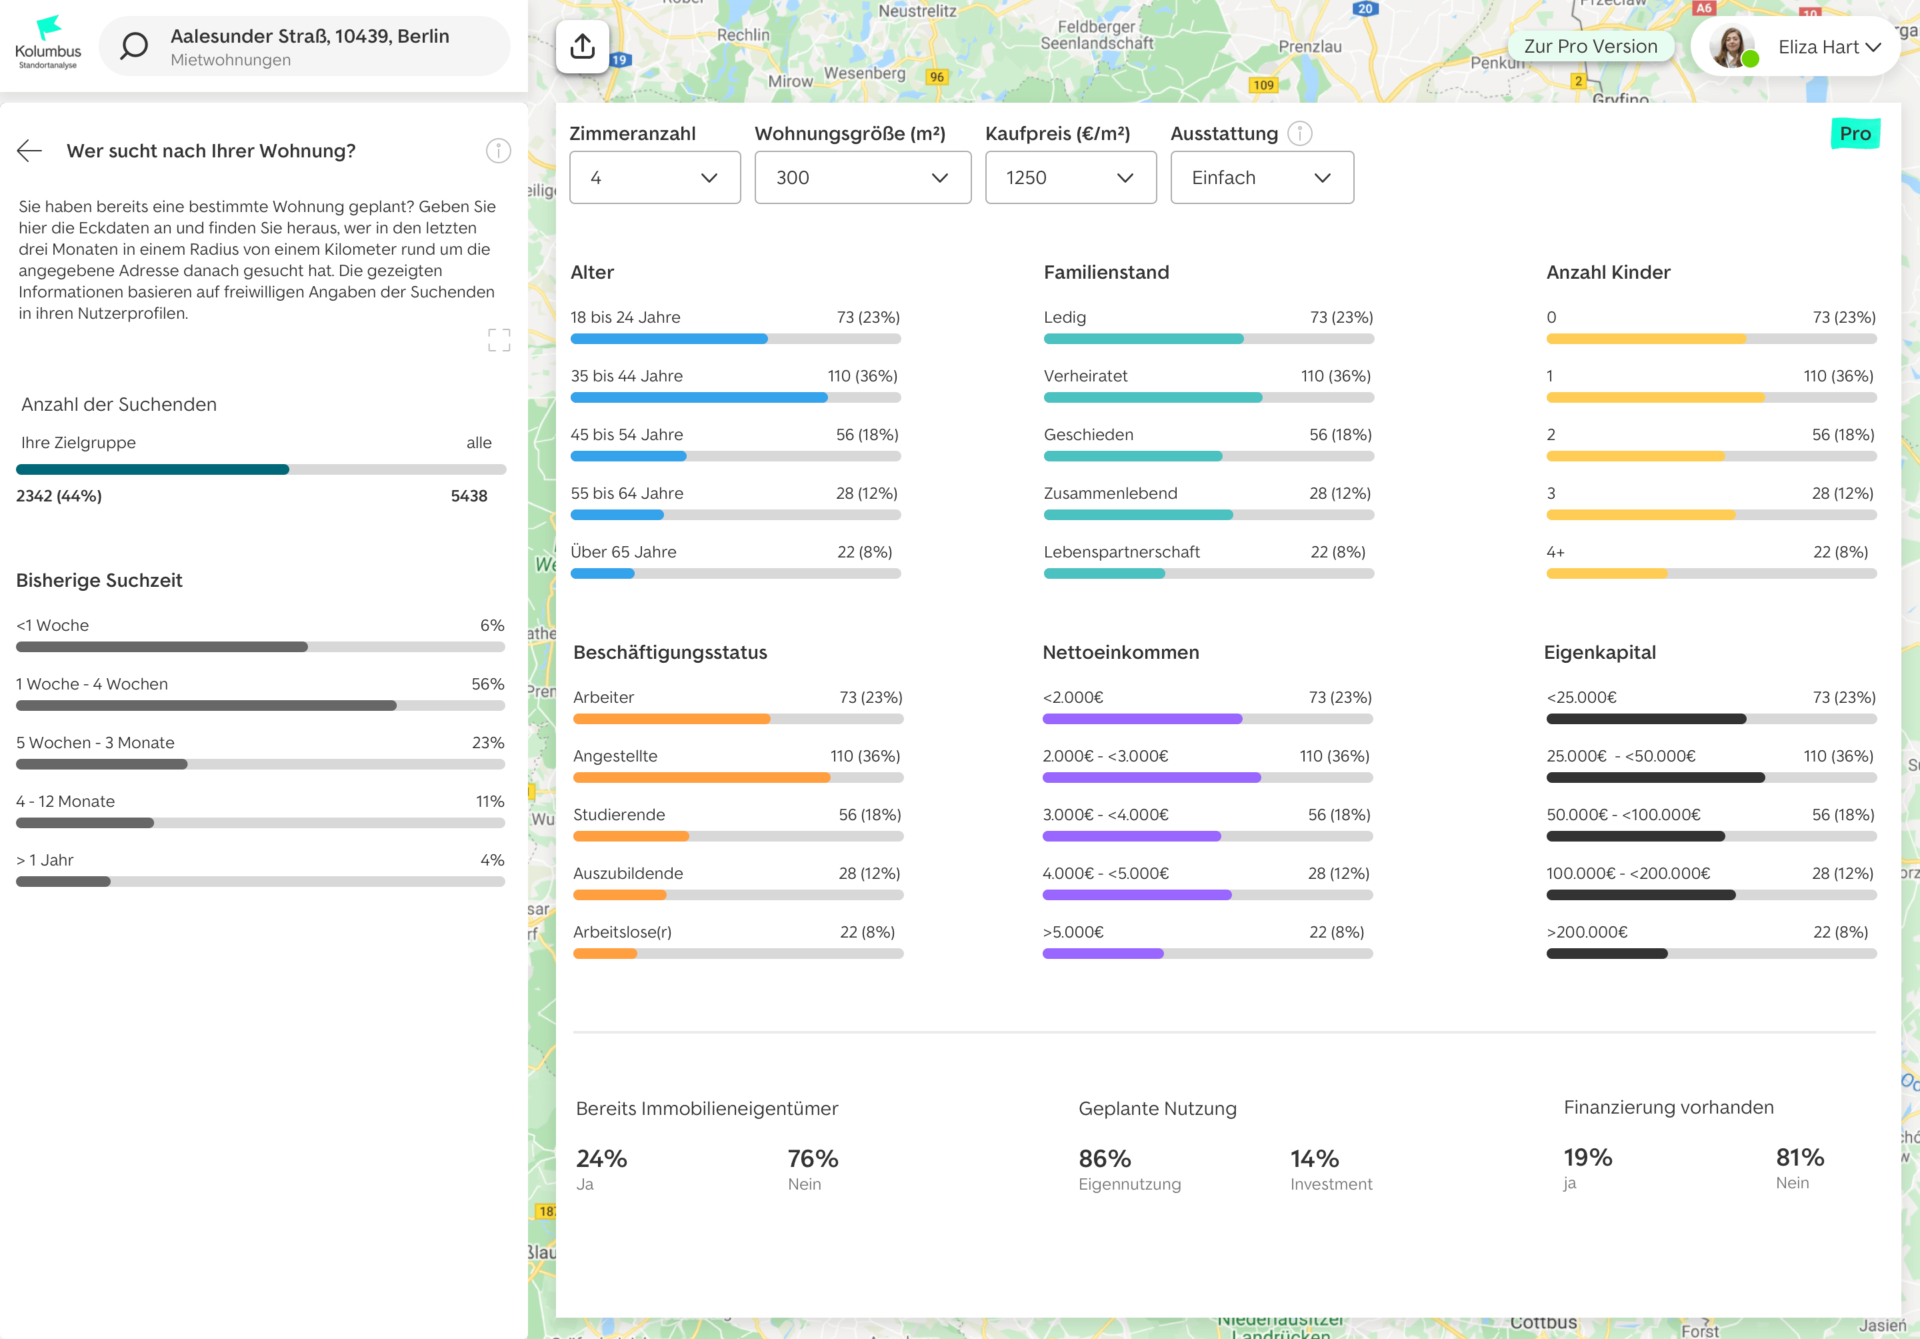
A location analysis tool consists of singular features that are relevant for both project marketers and developers that provide unique data, insights about competitors and the local market, planning opportunities, and revenue possibilities all in one place.
Outcome
The best in a class analytical tool for the German real estate market resulted in higher customer engagement and satisfaction. Increasing sales and subscription of the tool. Interactive and informative experience, giving the customer freedom of choice and make information easy to discover.
The challenge
In the real estate market, there are several players who define the success of a project, all the way from the acquisition phase to planning, design, and building a new project in the desired land plot.
During this journey, developers need a complete awareness of the market in order to determine project feasibility, forecast sales rates (market velocity), ensure the proposed plan matches the land and etc.
Regardless of the developers and project marketers’ target audience and scope, they need comprehensive data and information allowing them to confidently make decisions that will maximize the ROI of their future projects.
The approach
IS24 wants to provide trustworthy data for market players such as residential developers, commercial developers, asset managers, building owners, and agents.
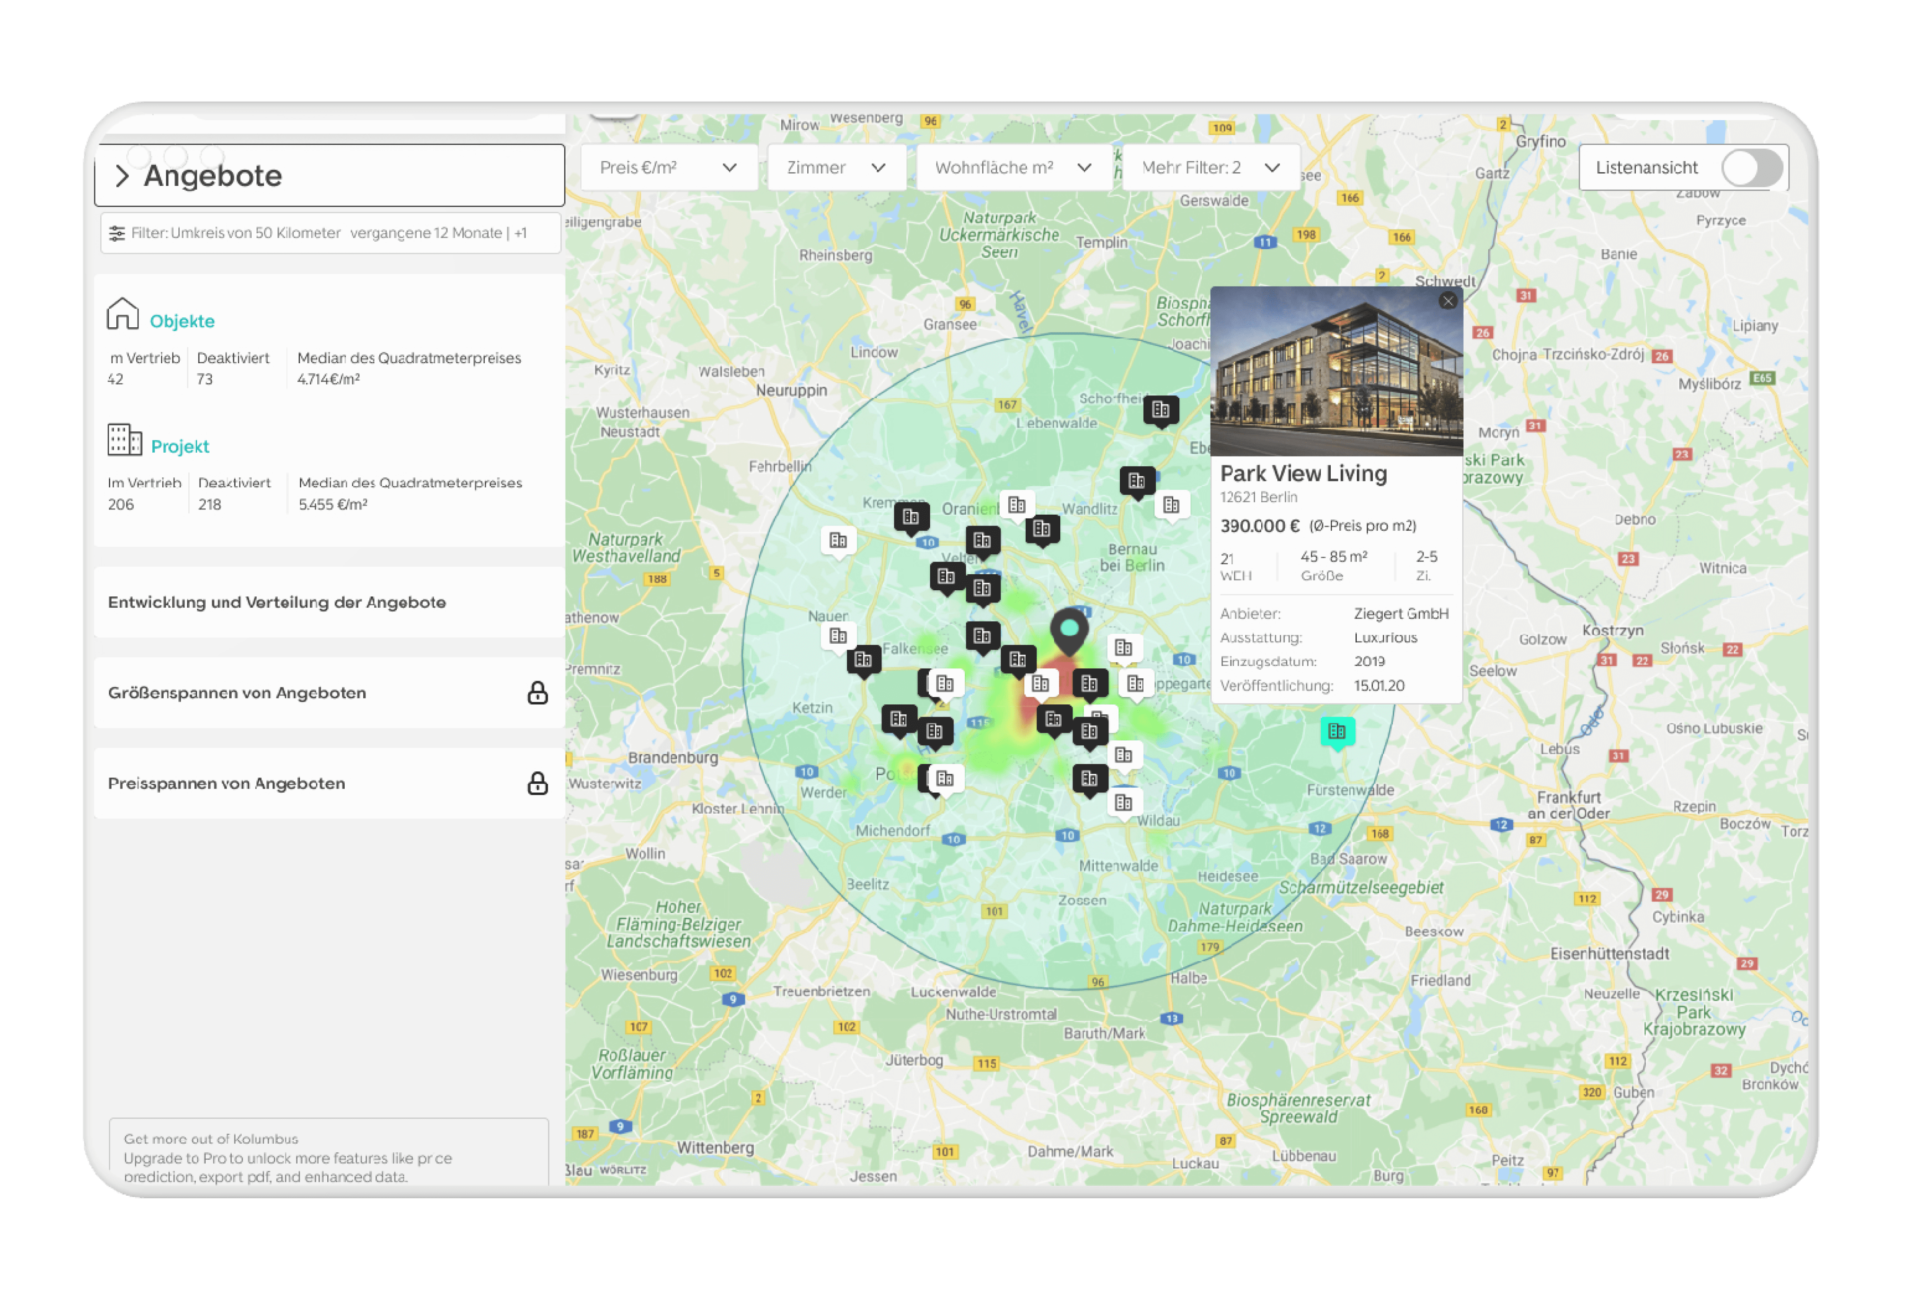
A data analysis tool that enables new mandates and partners, high price enforcement, and short marketing time, unlike external market reports and location analysis tools, the data product provides unique demand data, valuable insights about competitors and the local market – all in one place – and fits perfectly in the developer lifecycle.
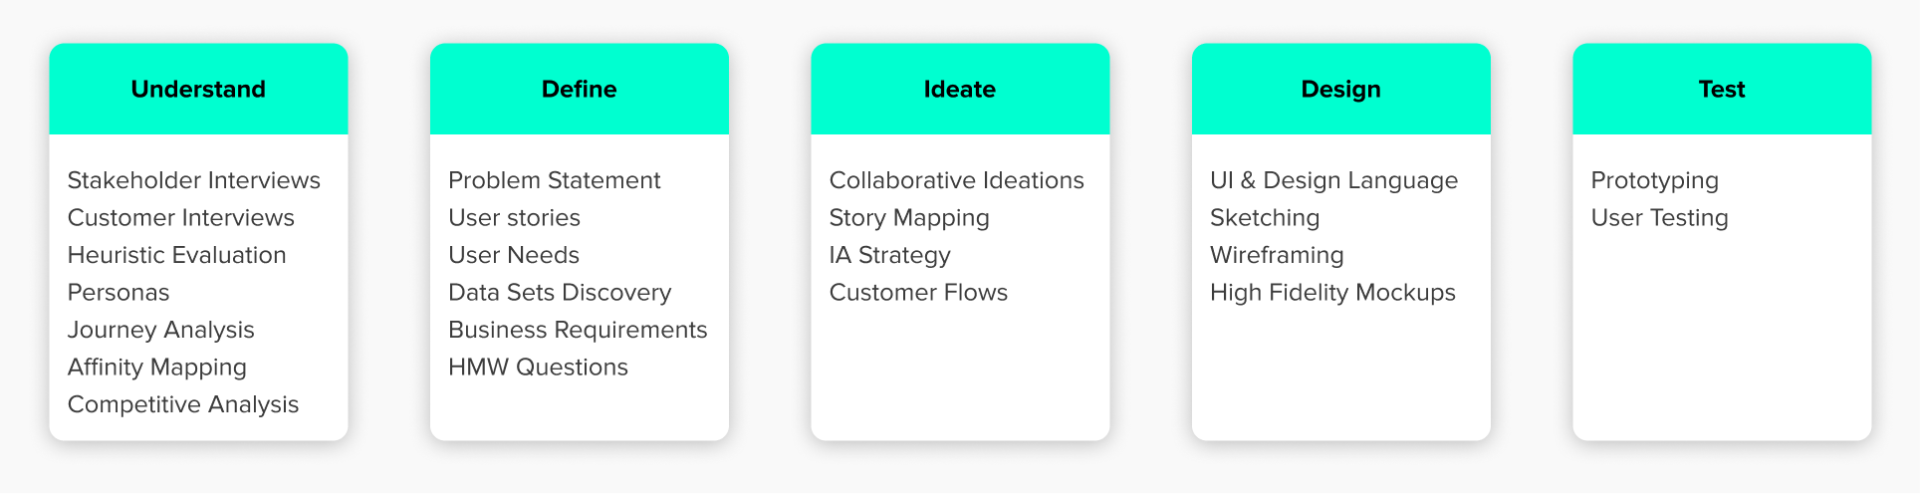
design process
design principles
- Create an industry-leading location, competitor, and market analysis tool that adds value and convenience for all customers.
- Provide the full spectrum of insights, data, and planning opportunities to help to guide our customers when they need it.
- The experience instills trust in the customer, confidently ensuring that project marketers and developers have everything they need for a successful and seamless service.
- Our experience respects the customer’s time, needs, and wants by allowing our customer to be in charge of how and in what granularity of data they want to access it.
Personas

The small property developer works in the Groß-Gerau district in Hesse and knows his surroundings very well. He plans projects from experience. He invests a lot of marketing budget in print because he wants to assert himself against his competitors and has had good experiences with it in the past.

The medium-sized developer is active regionally in the district of Frankfurt and in an extended environment such as Wiesbaden. He markets both large and small projects and knows the region well. The owner is 46 years old and has 10 other employees.

The large property developer company is partly active throughout Germany and professionally markets many projects simultaneously across all channels. The challenges are marketing to English-speaking customers and pre-marketing.
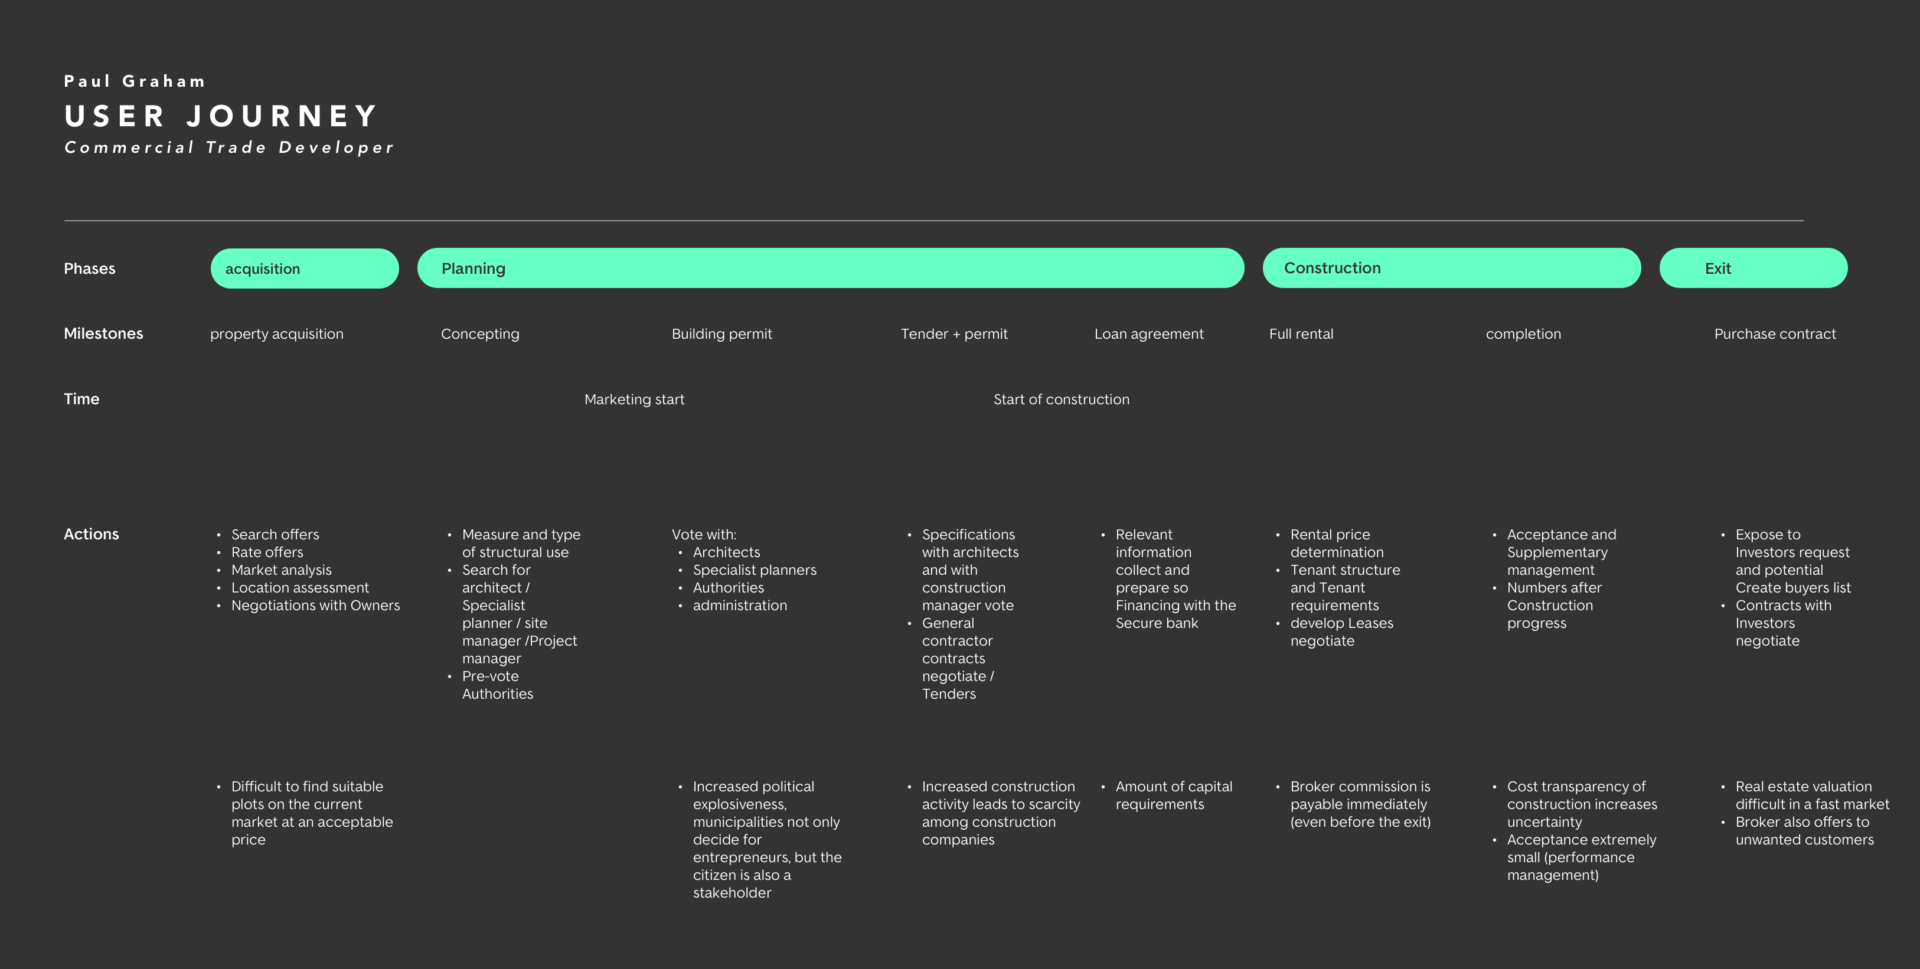
Developer's journey analysis
Exploring the developer’s journey helped us to understand the main actions and pain-points occurring during the land acquisition phase. This is when developers need varied information from size, price-trend, accessibility, demand, and supply of the area to evaluate the general state of the property market.
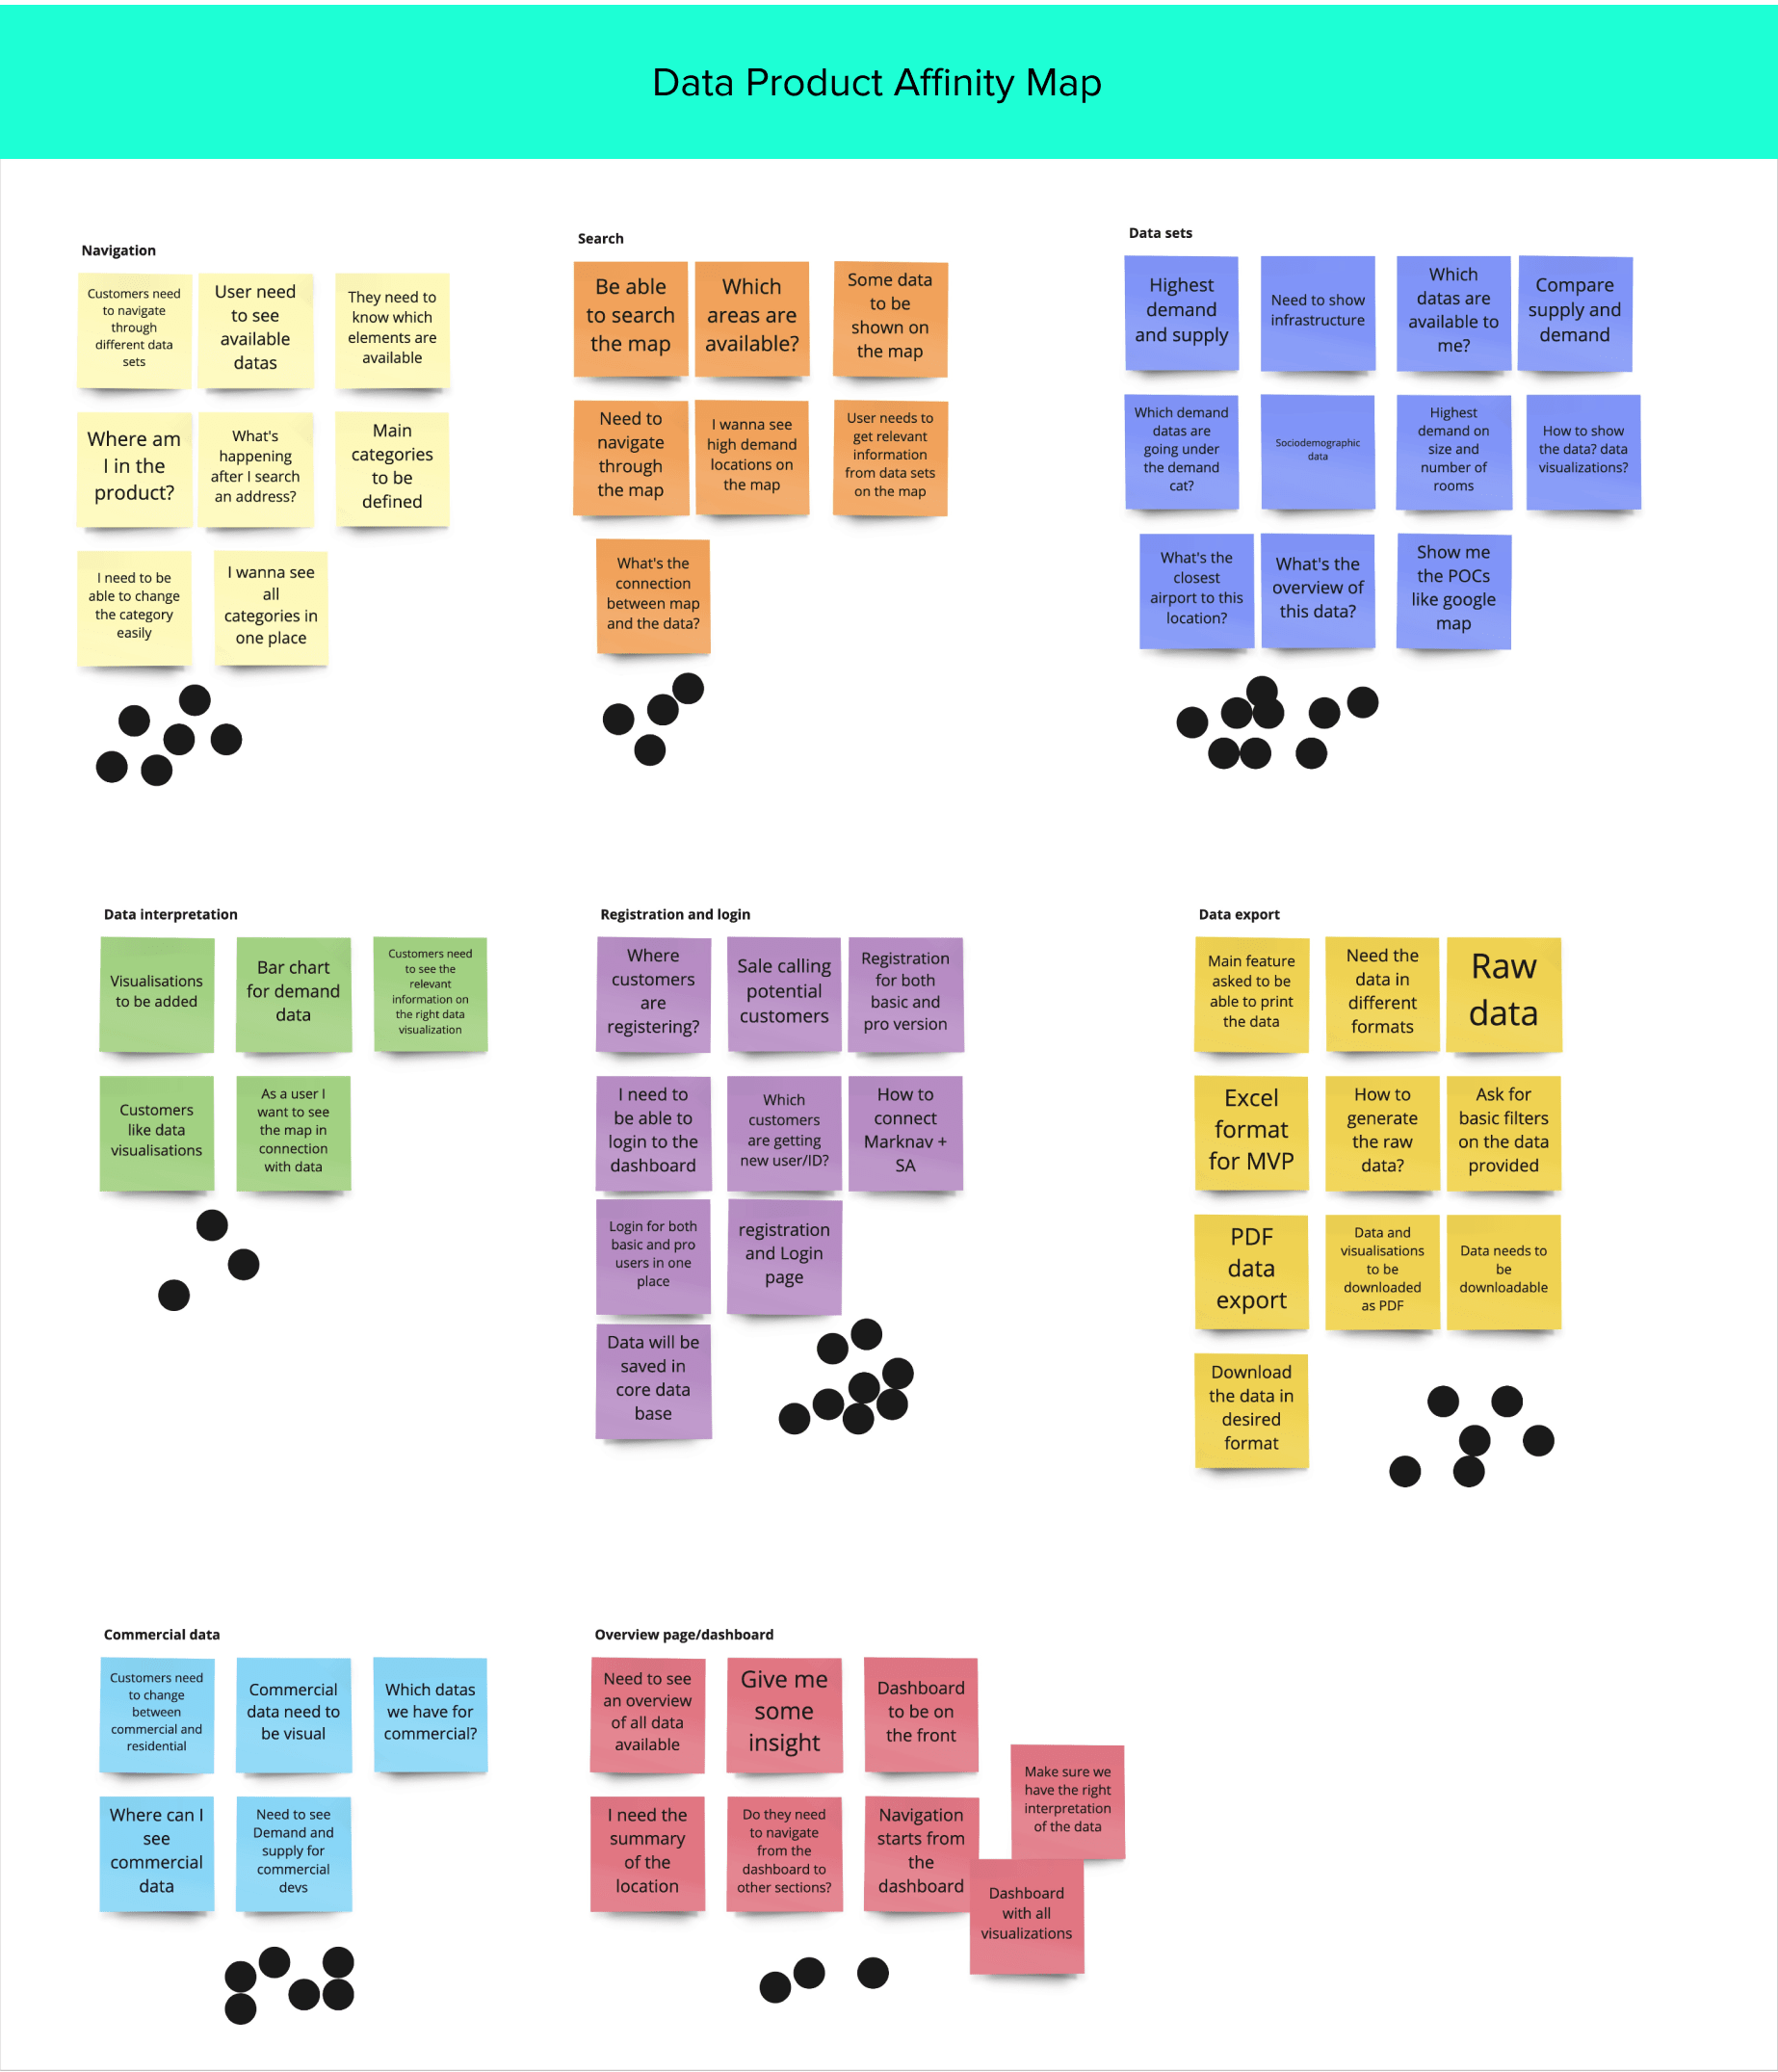
Affinity mapping
After gathering all the necessary research and developed enough findings, we used the affinity mapping technique to cluster our observations into main categories to focus on. With that, we had a clear roadmap of which features and areas we need to implement for our vision.
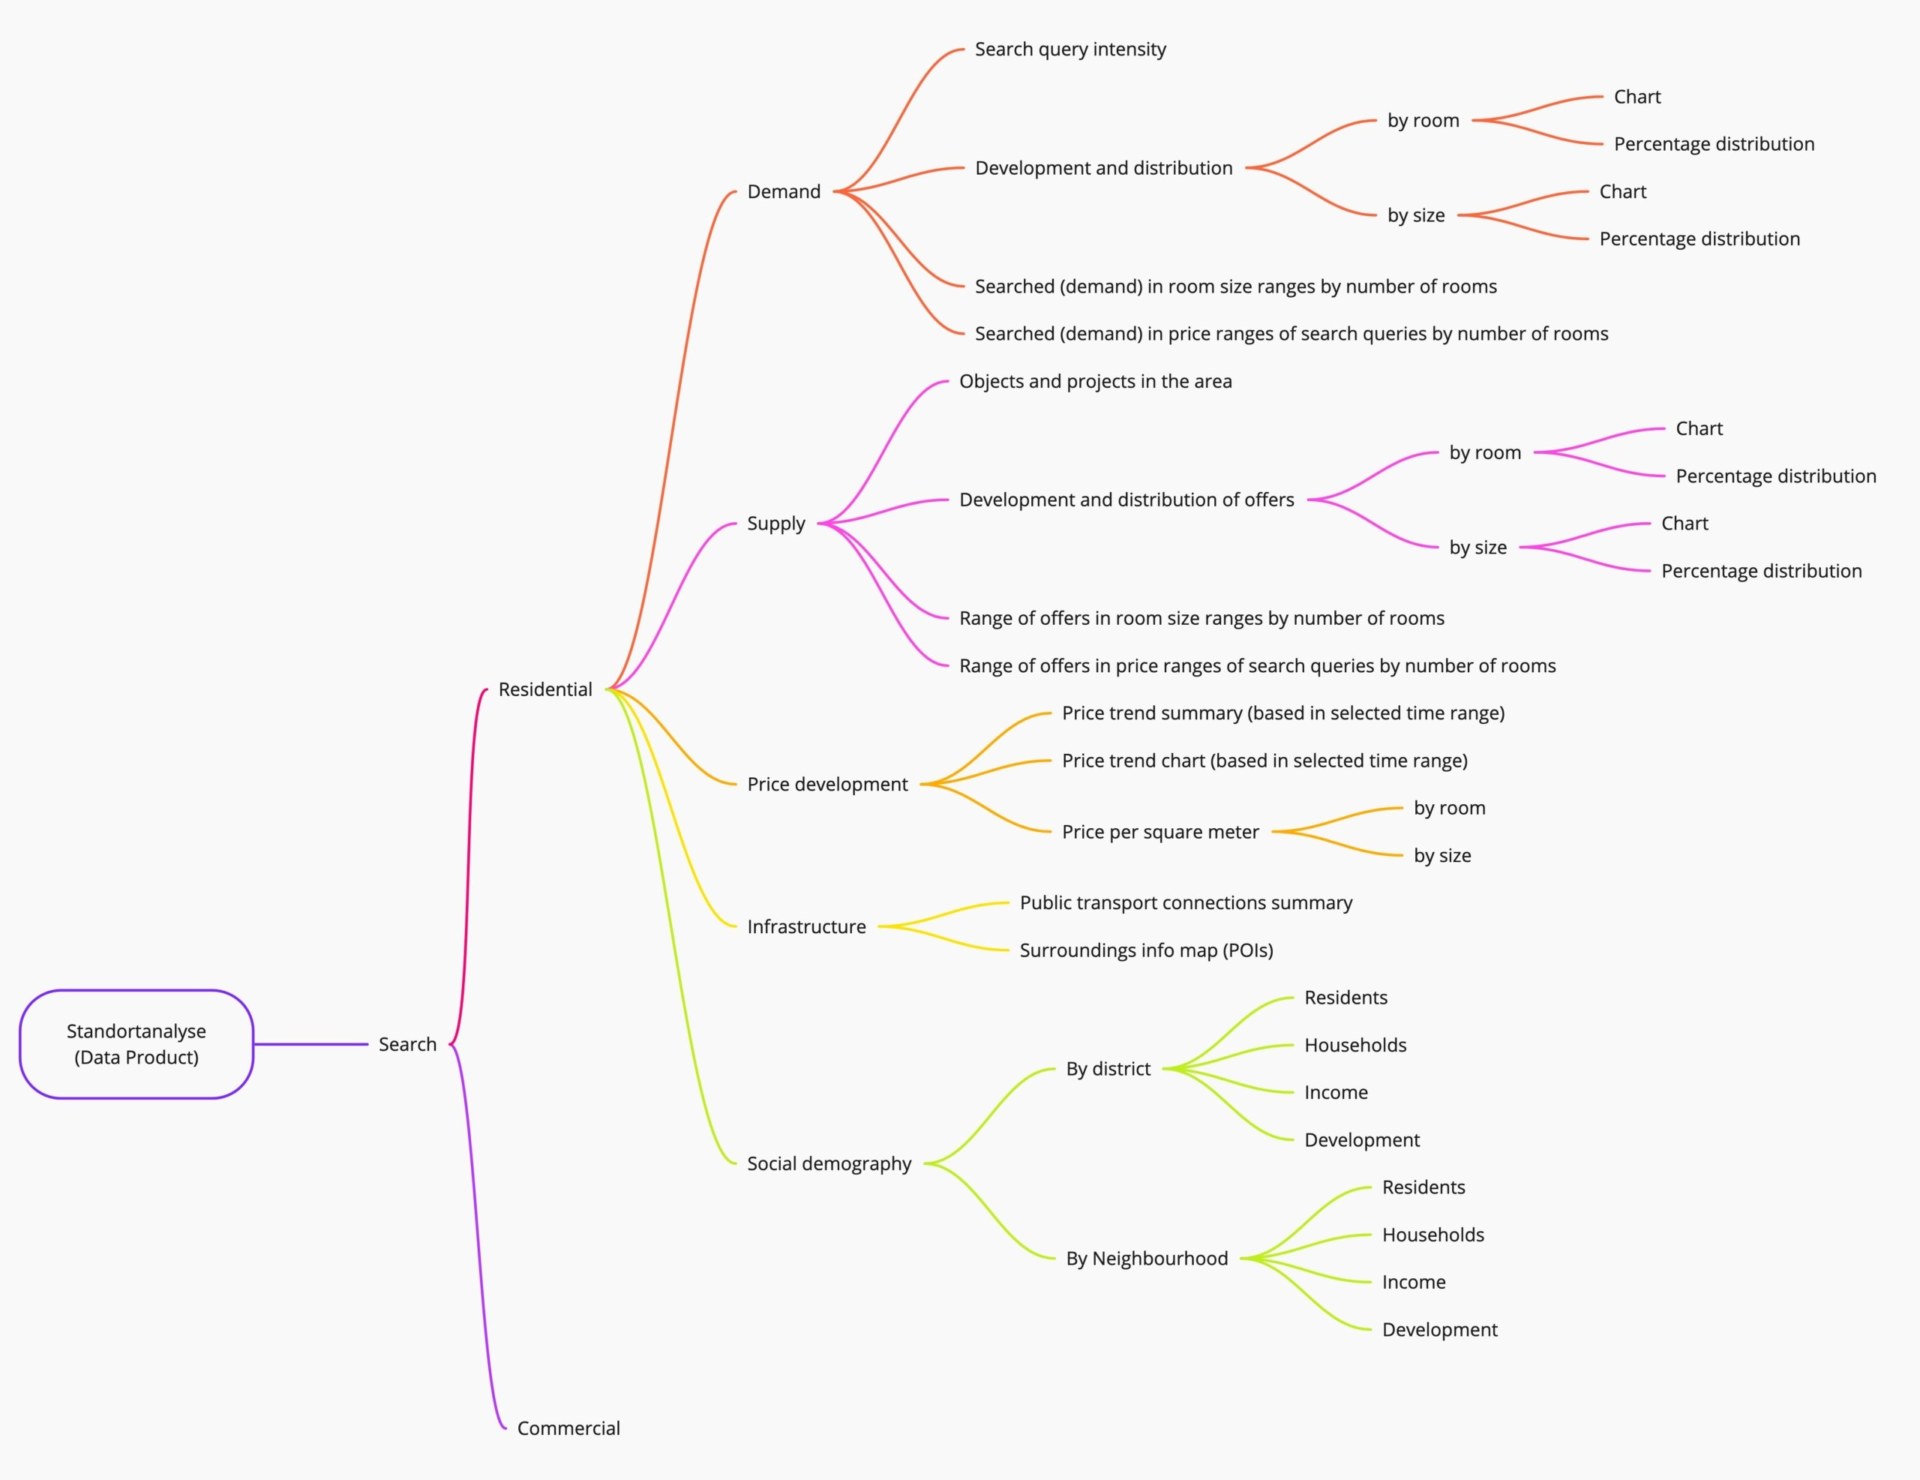
Data sets discovery
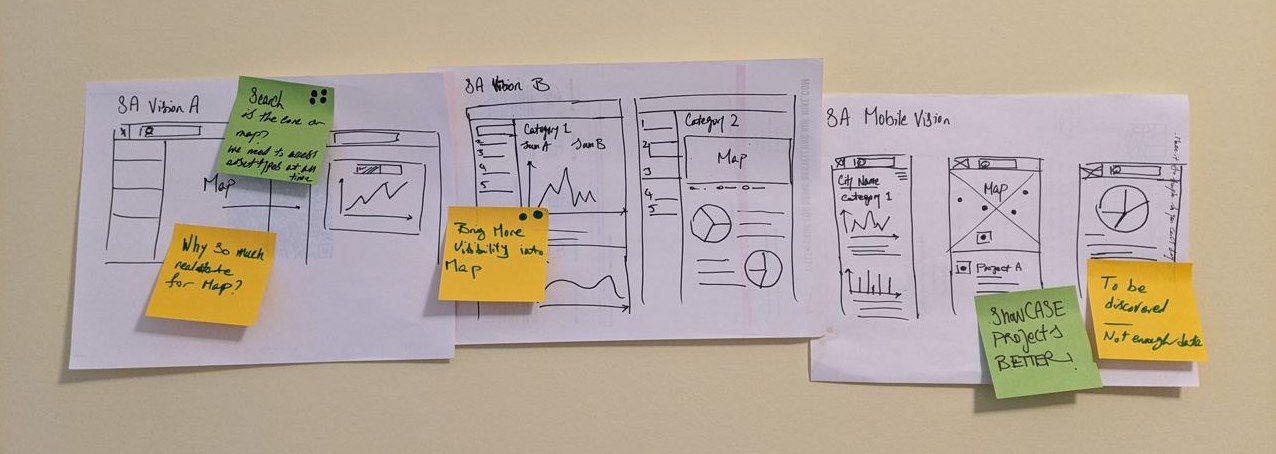
Collaborative design ideation
After having a full understanding of the problem area and where we should focus, we needed the whole team to participate in ideation and sketching for how the product could look like for both mobile and web. We first started with a 10-minute individual design following by discussing the most promising navigation and layout possibilities with both product owner and developers in the room.
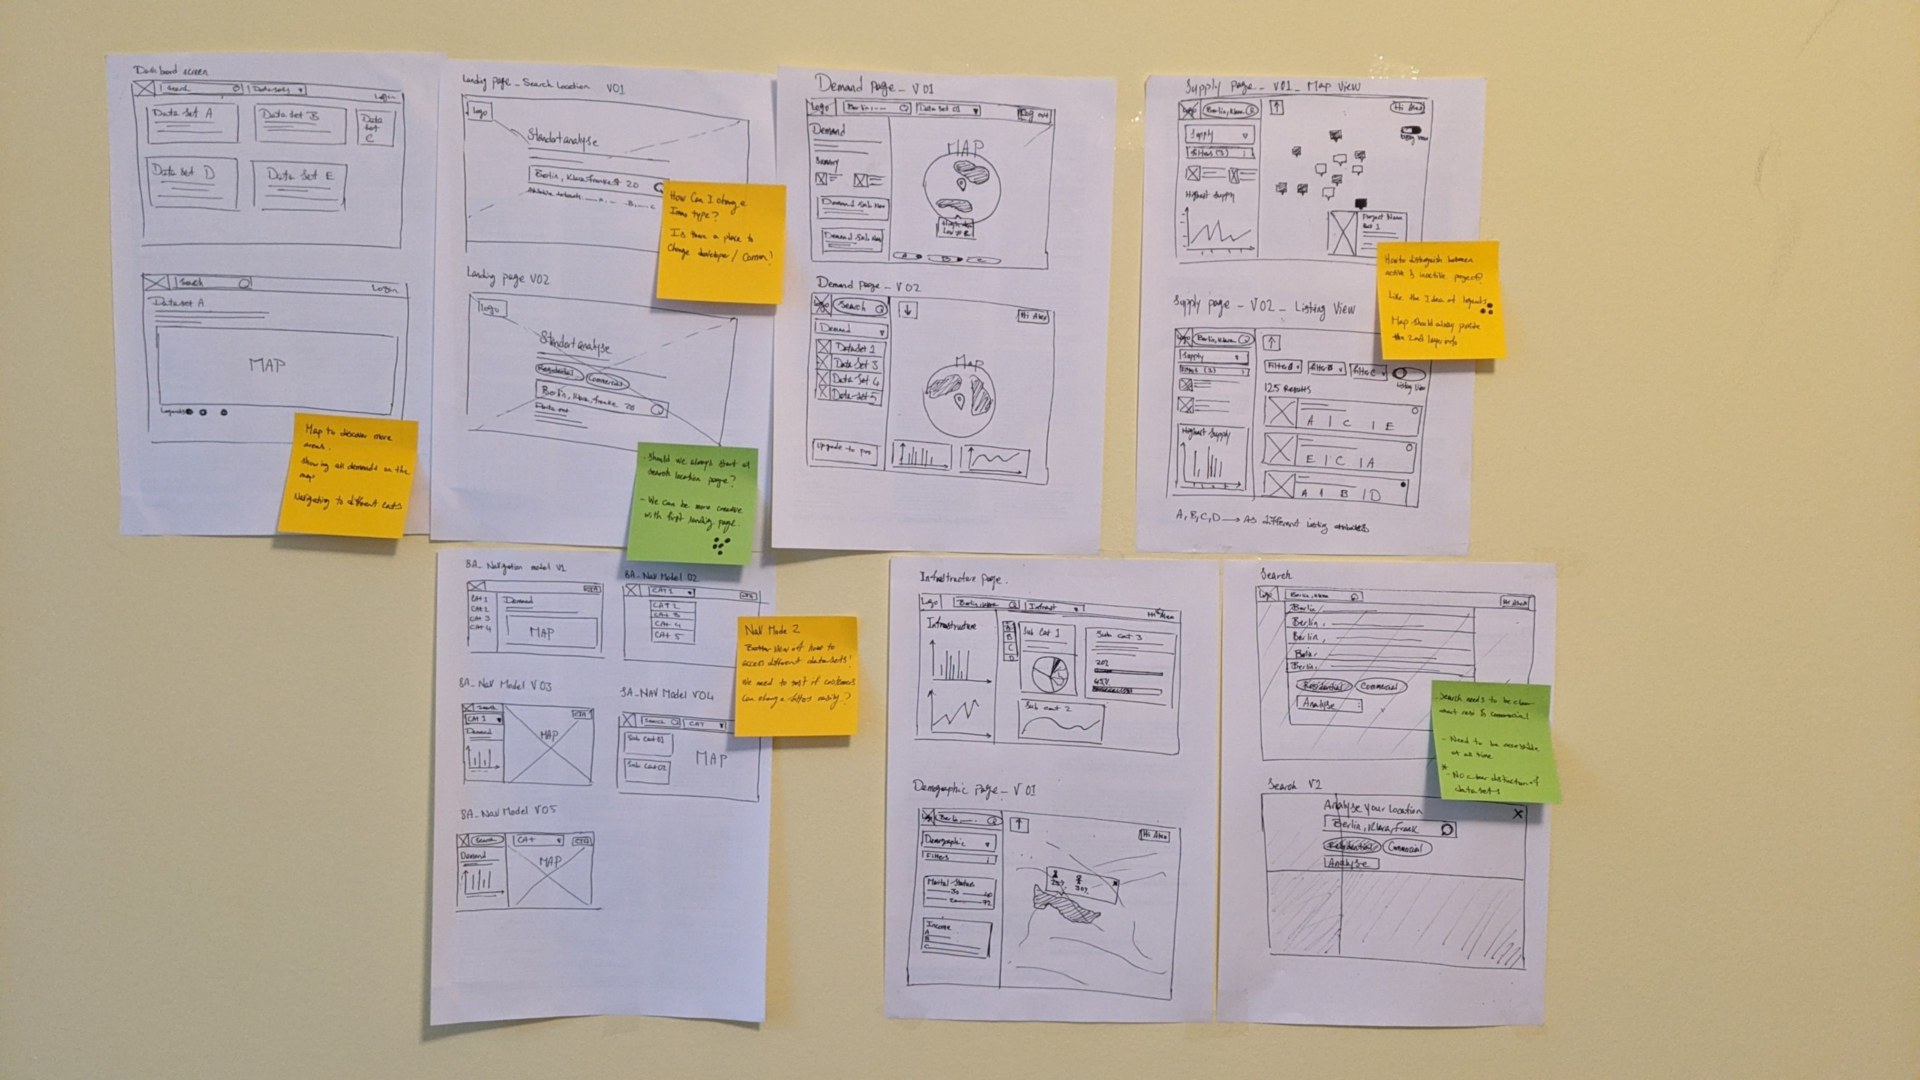
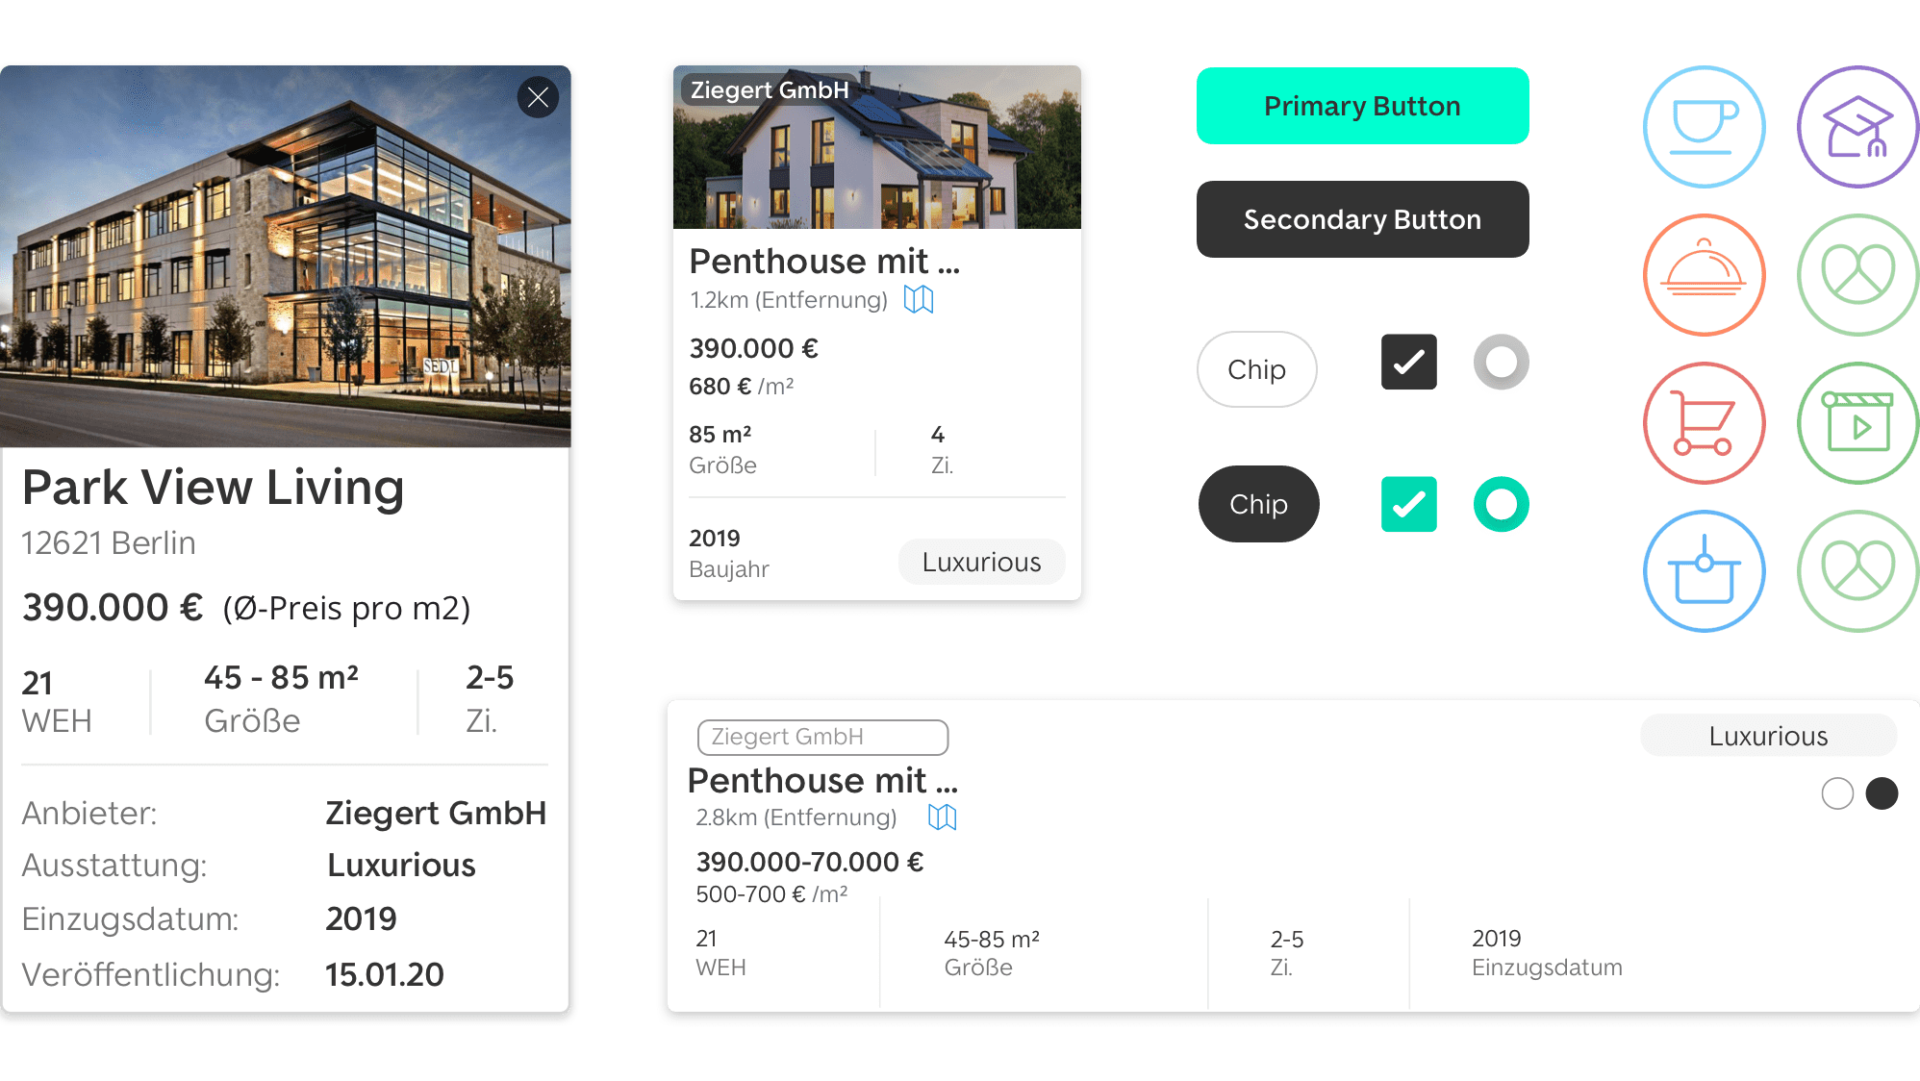
Mockups
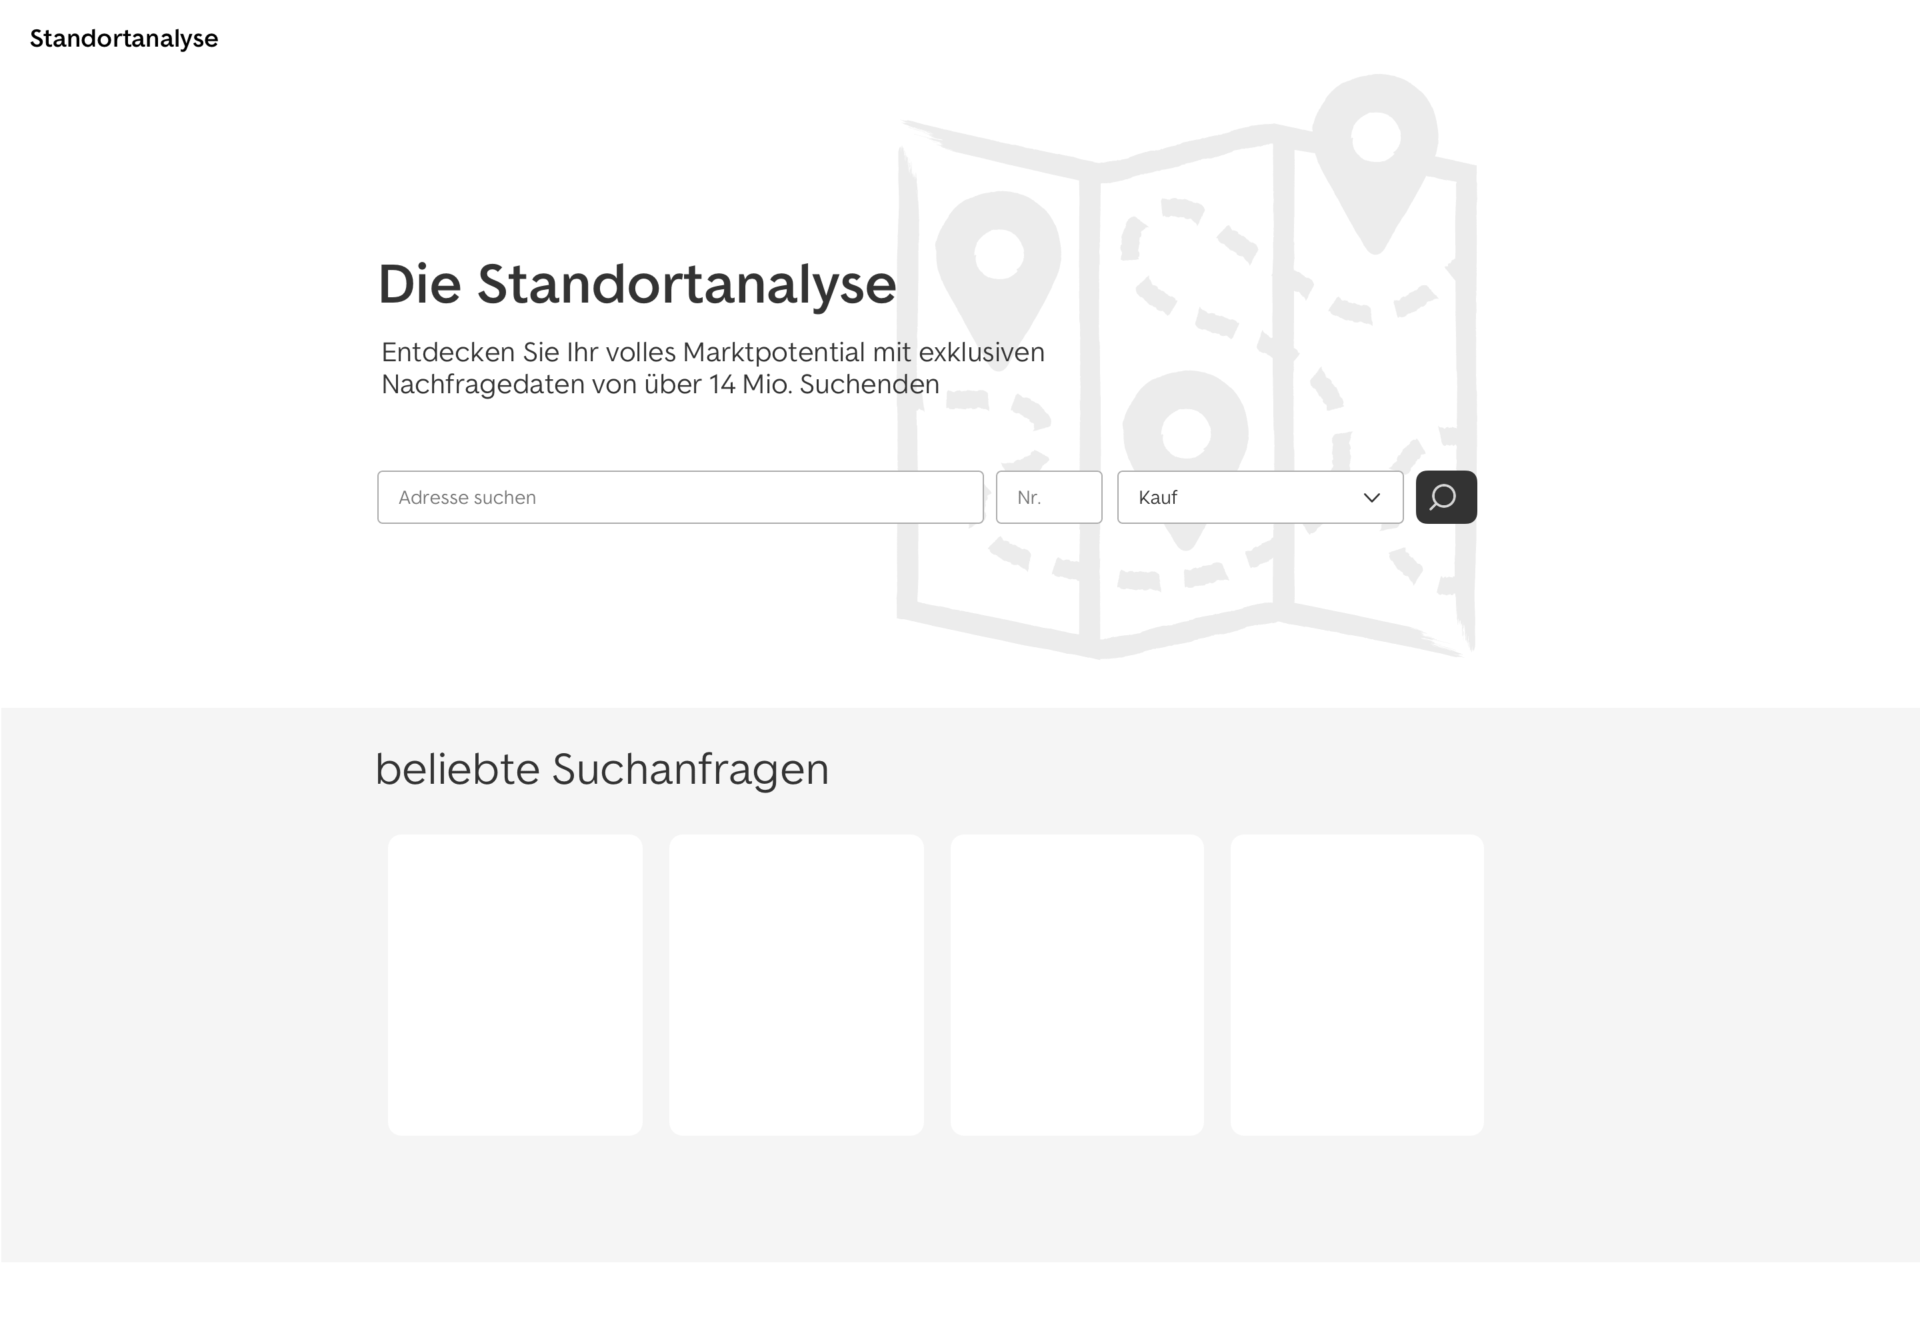
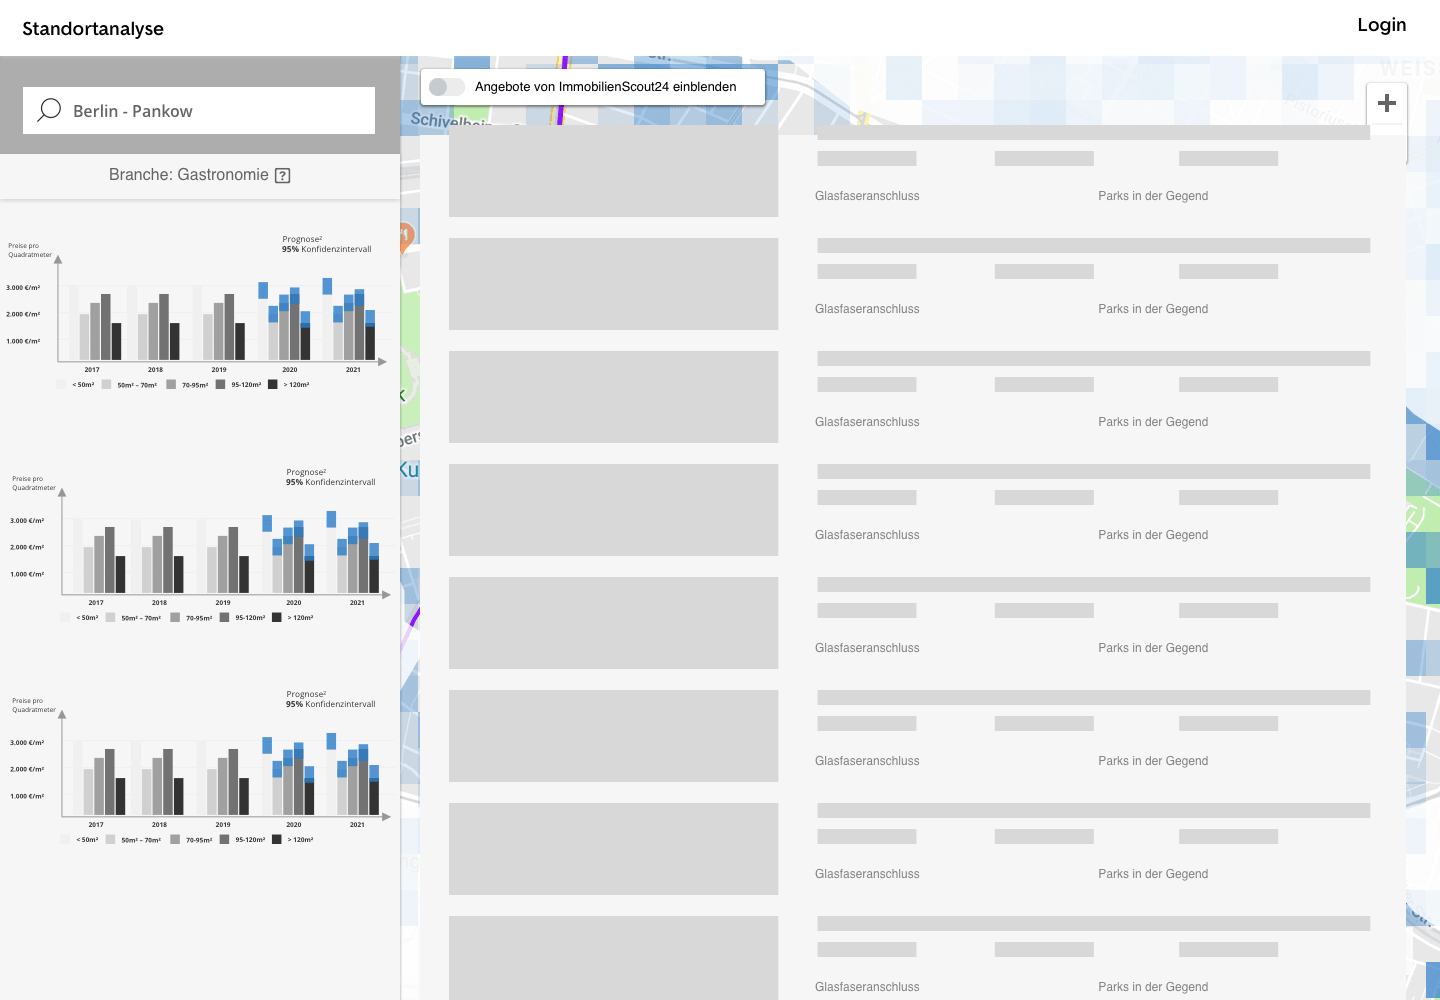
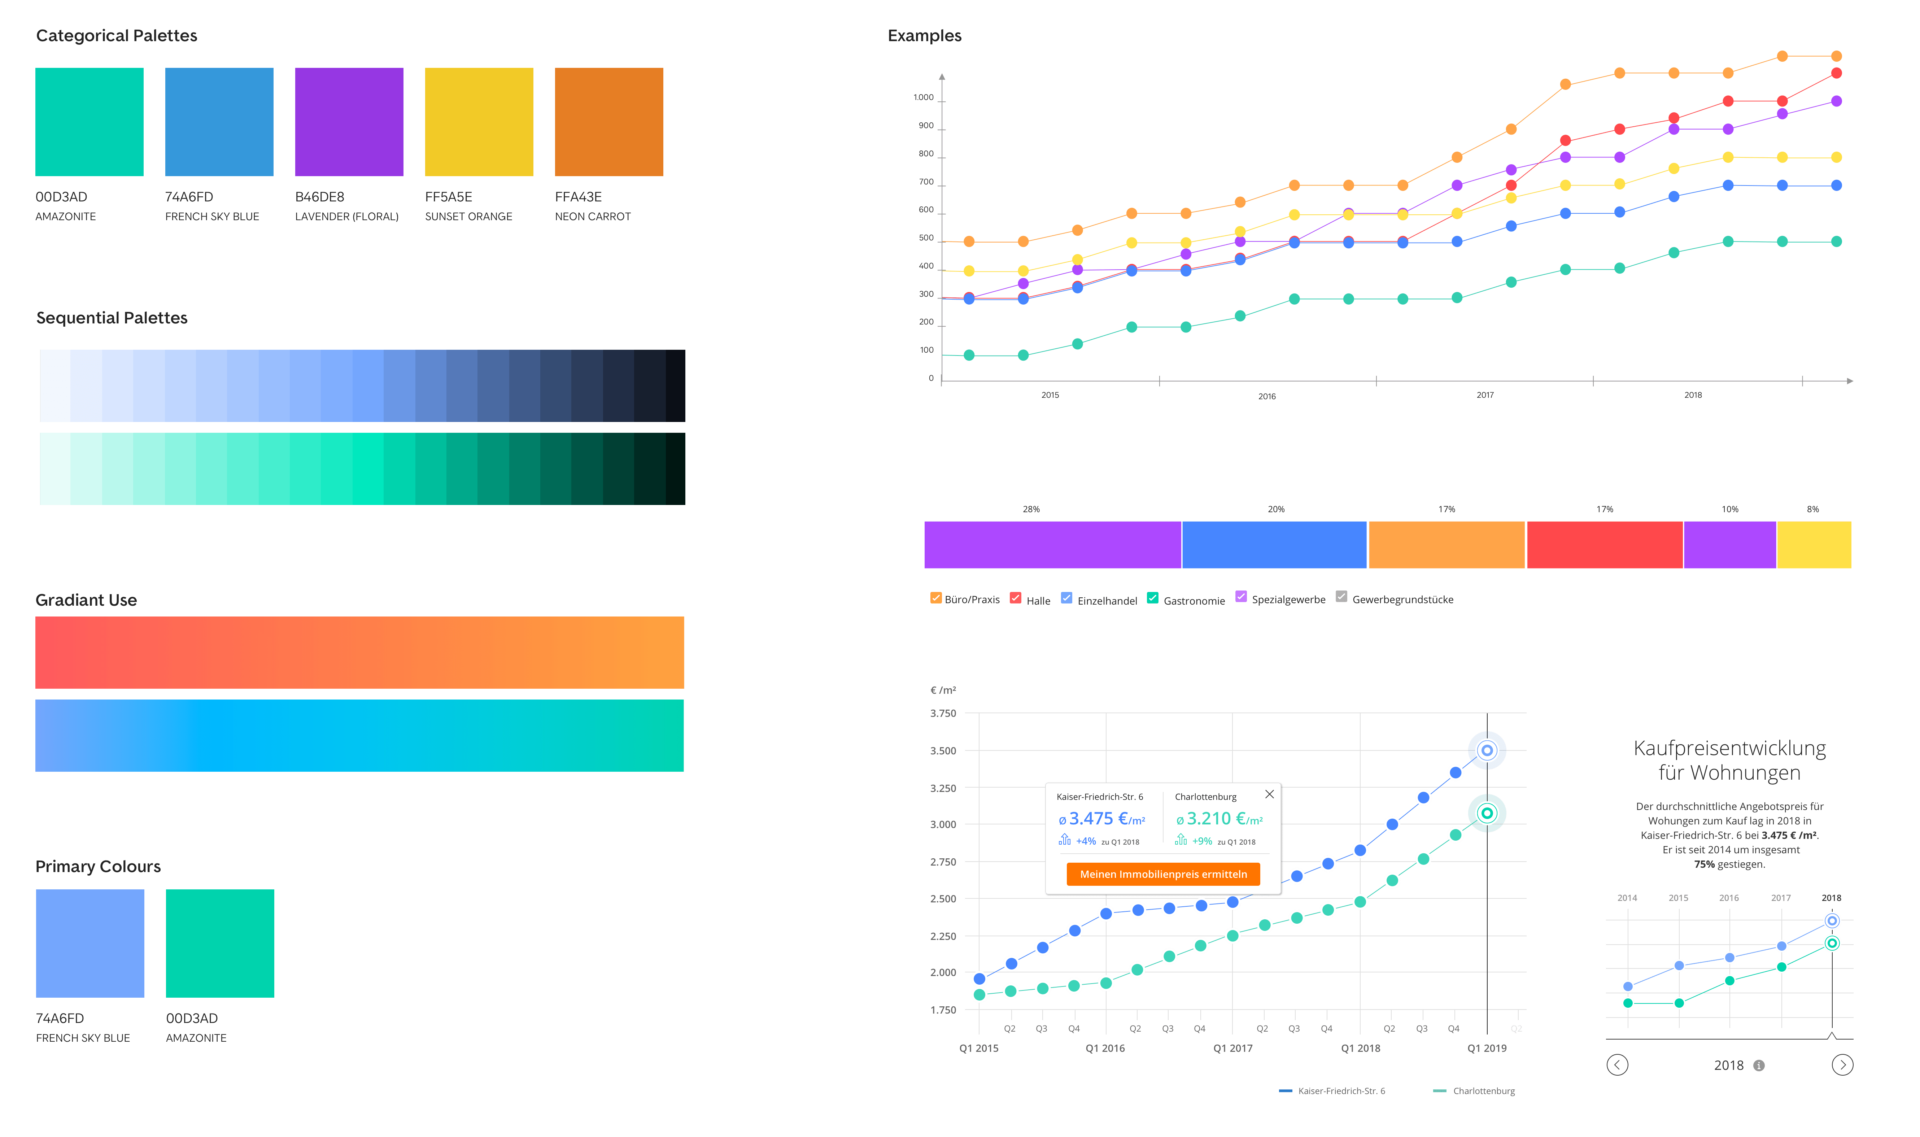
Visual elements exploration
Navigation model
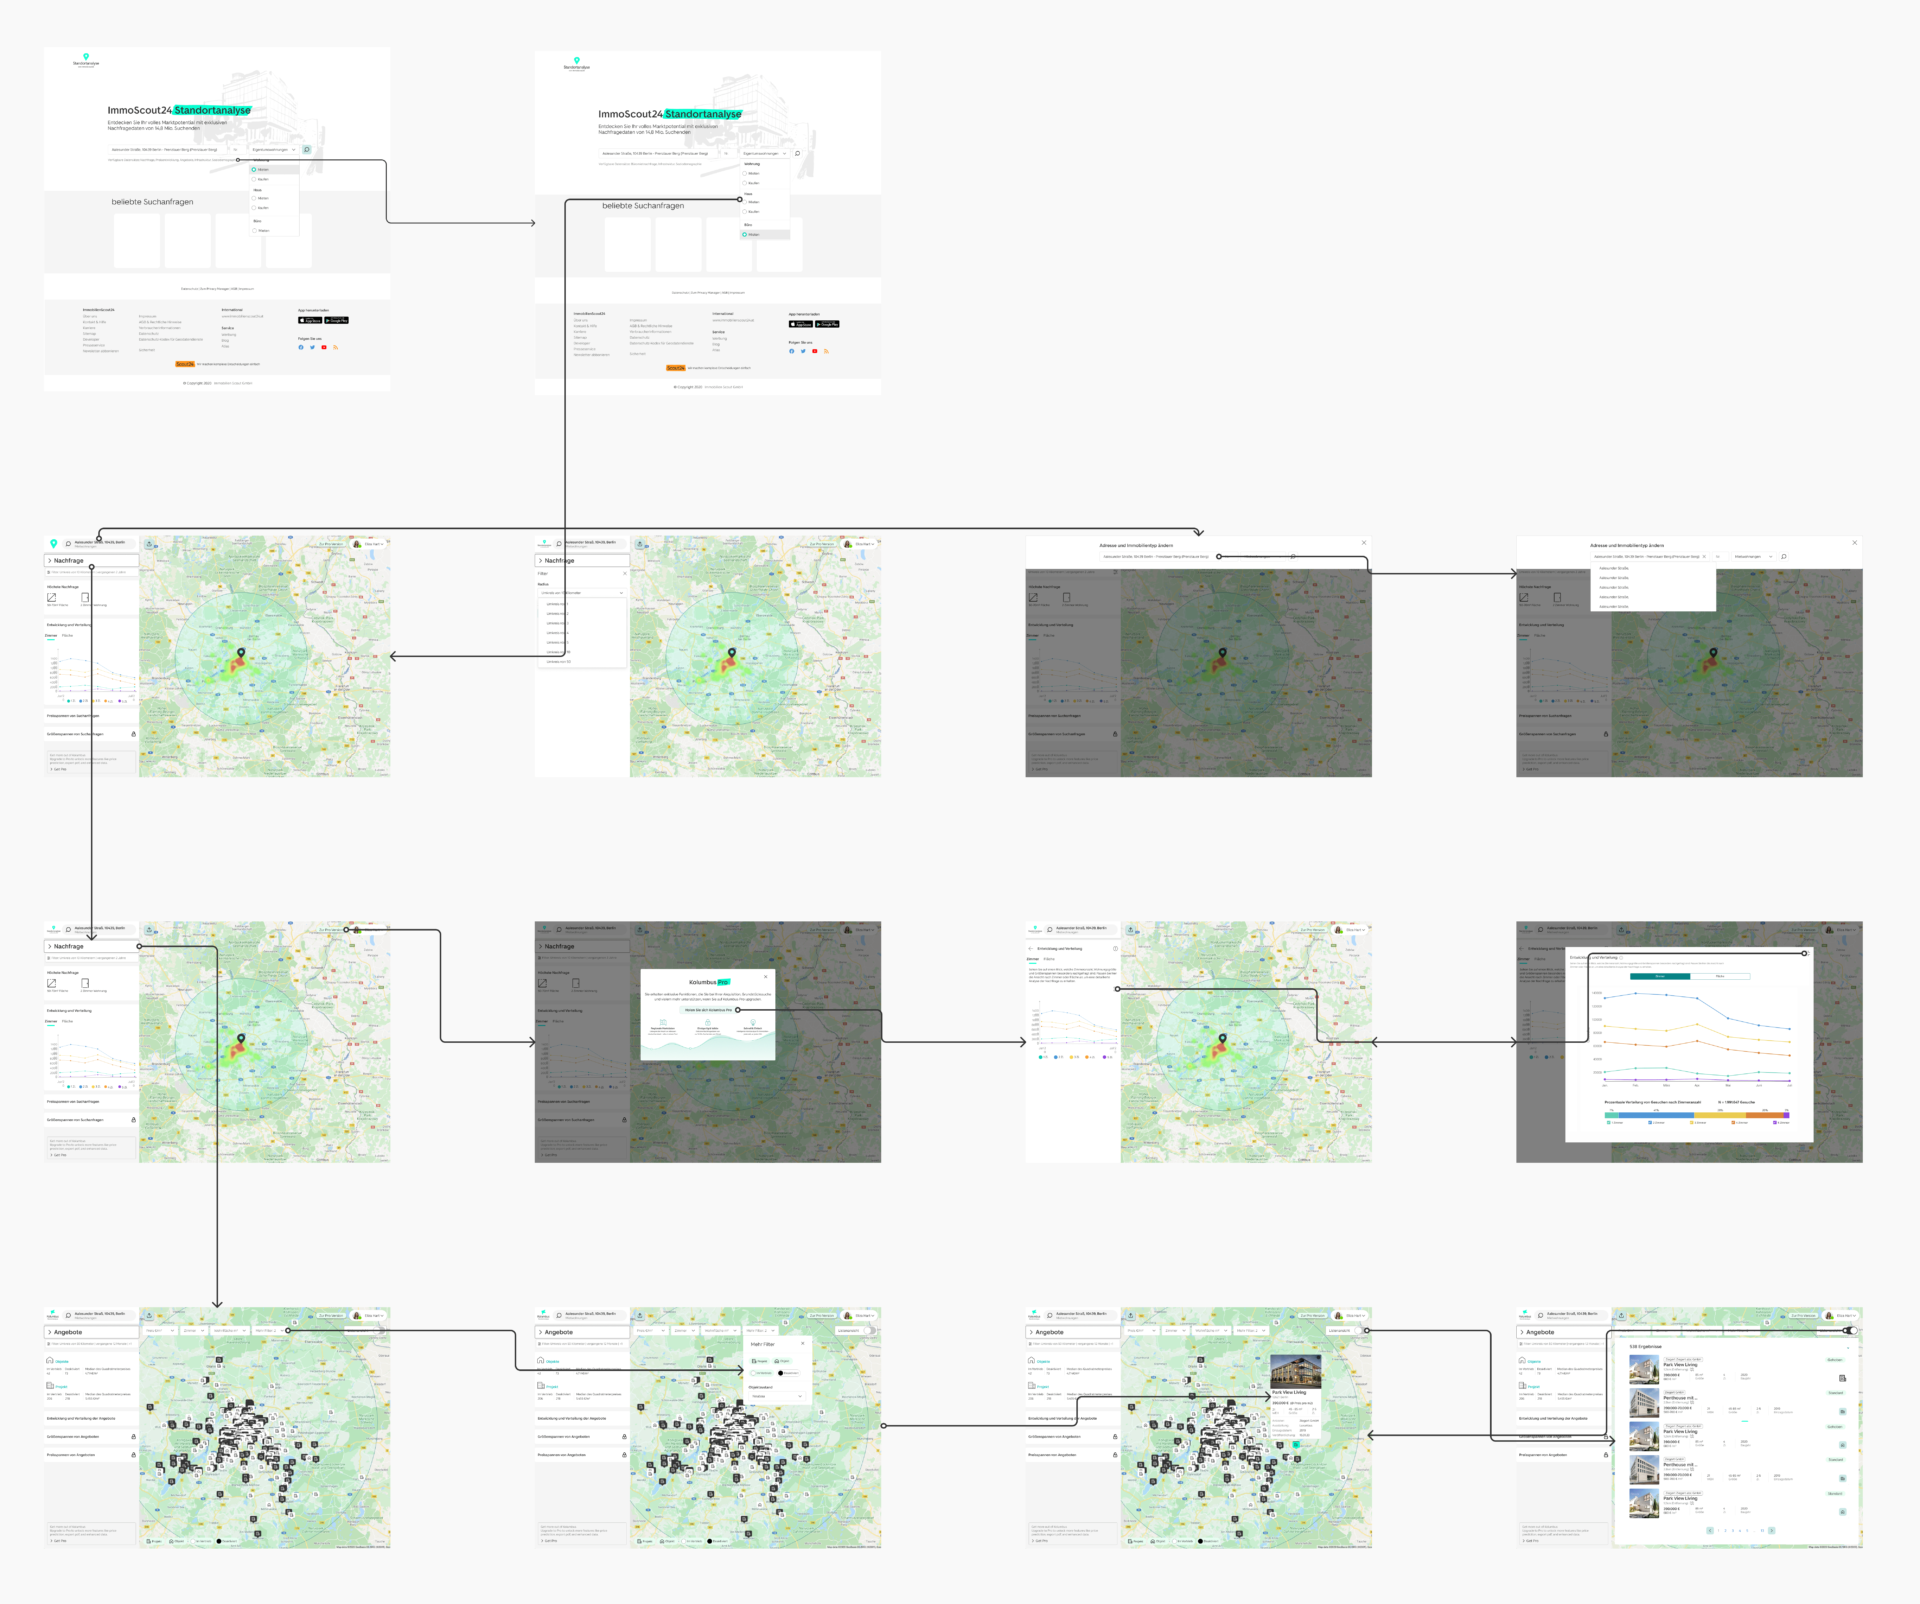
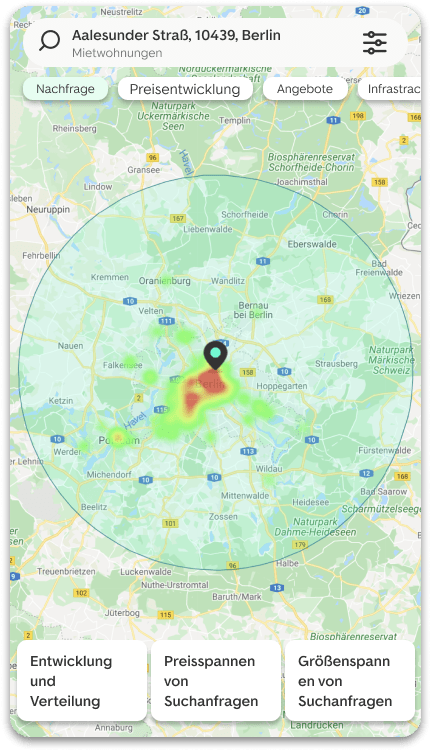
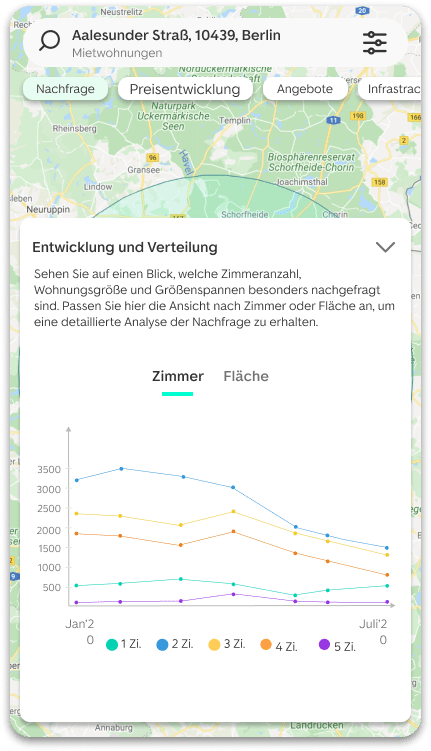
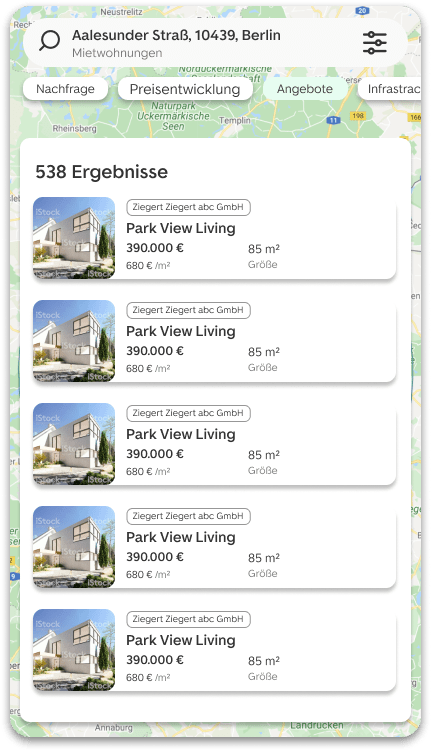
Mobile view
User test
The goal of the test was mainly to redefine the navigation model as well as the general information architecture of the tool in order to efficiently add more features and data sets in the future and bring a seamless transition to the new Data product’s navigation model .
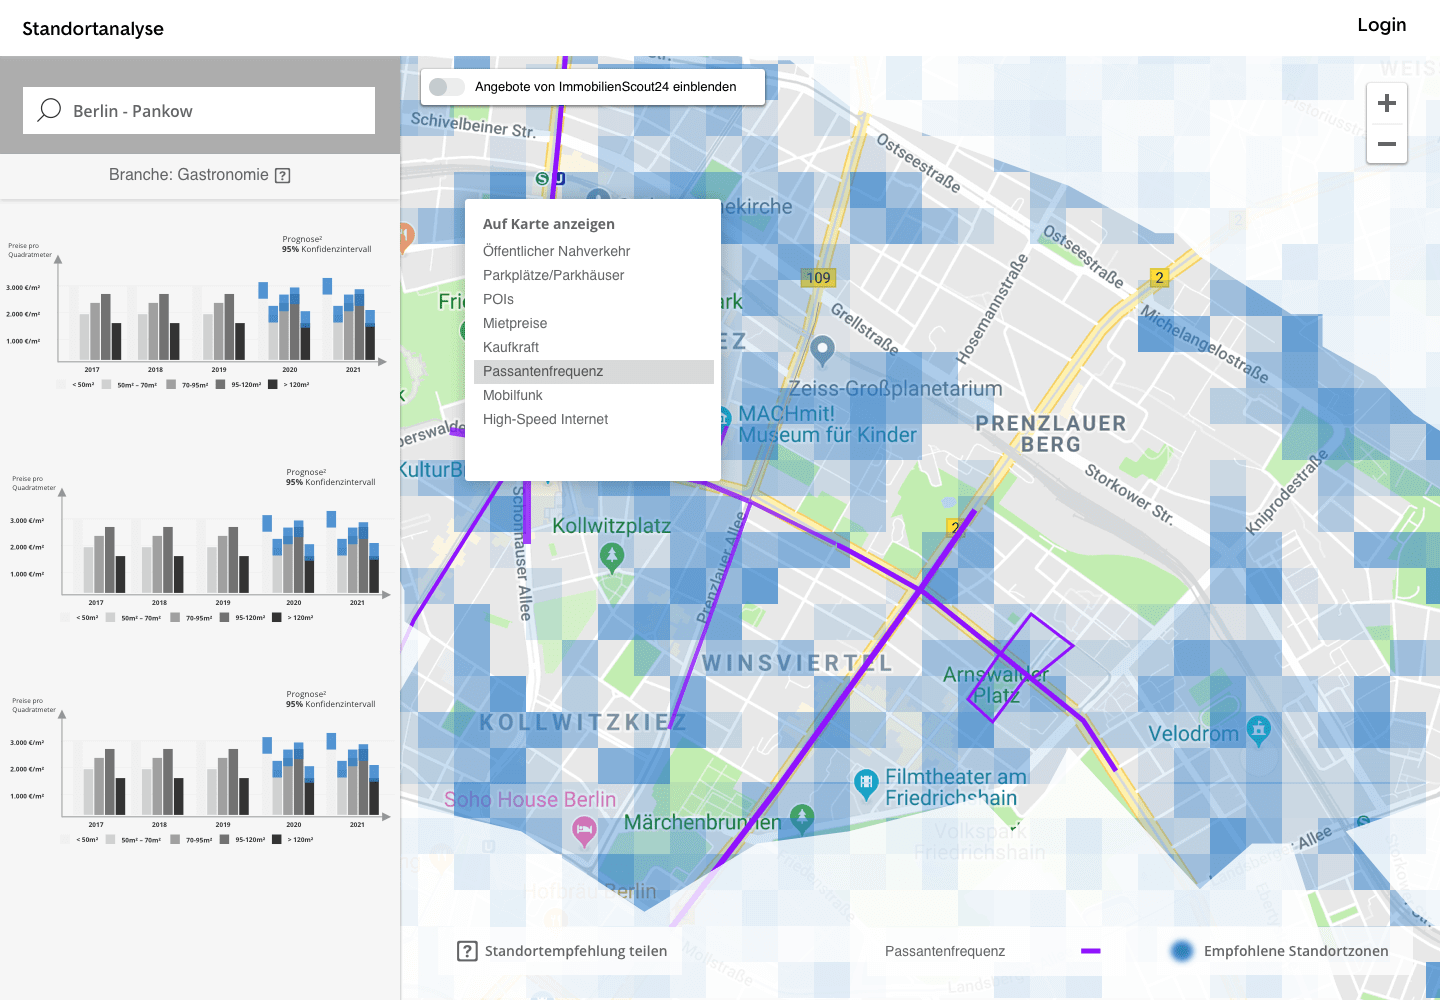
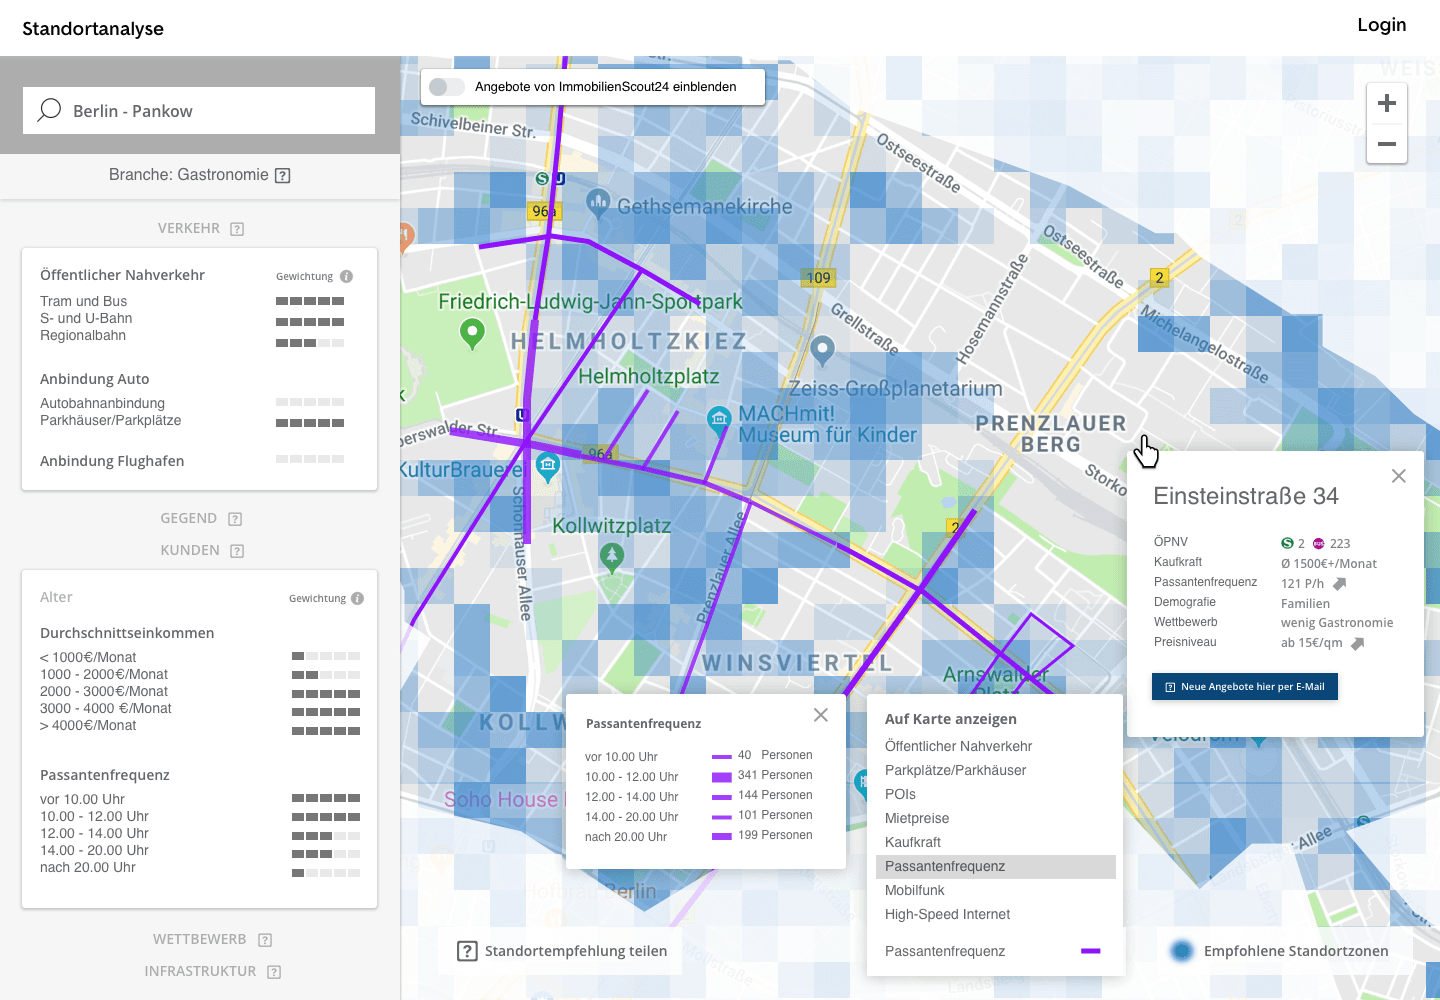
The main changes made to the interface concern the navigation system, data filtering and the placement of the charts and the map.
Version A
Version B
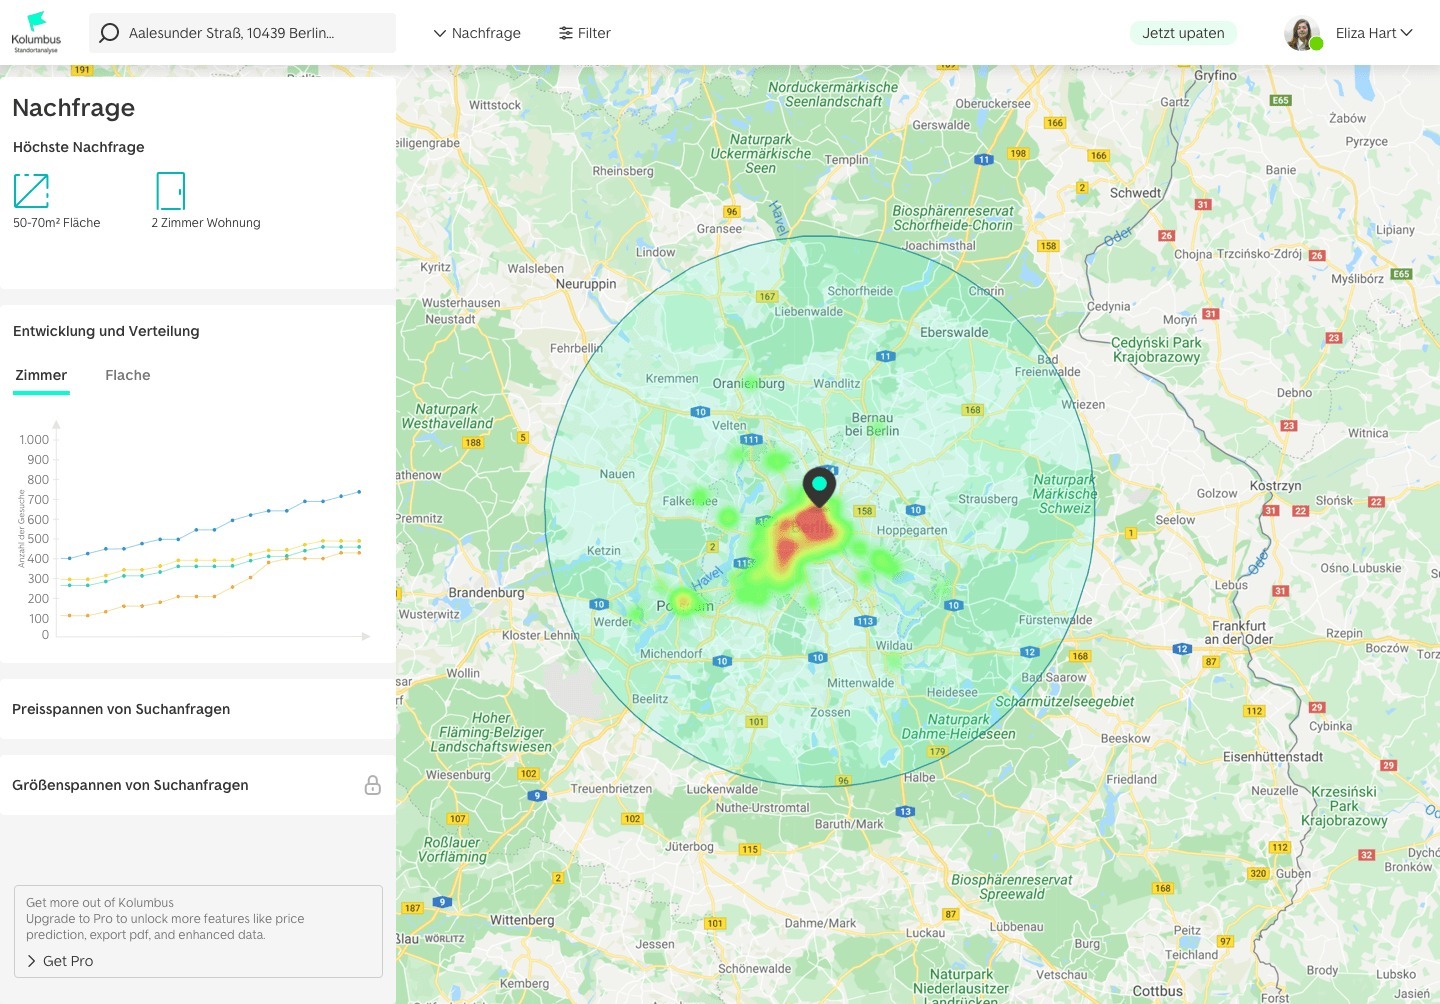
Version C
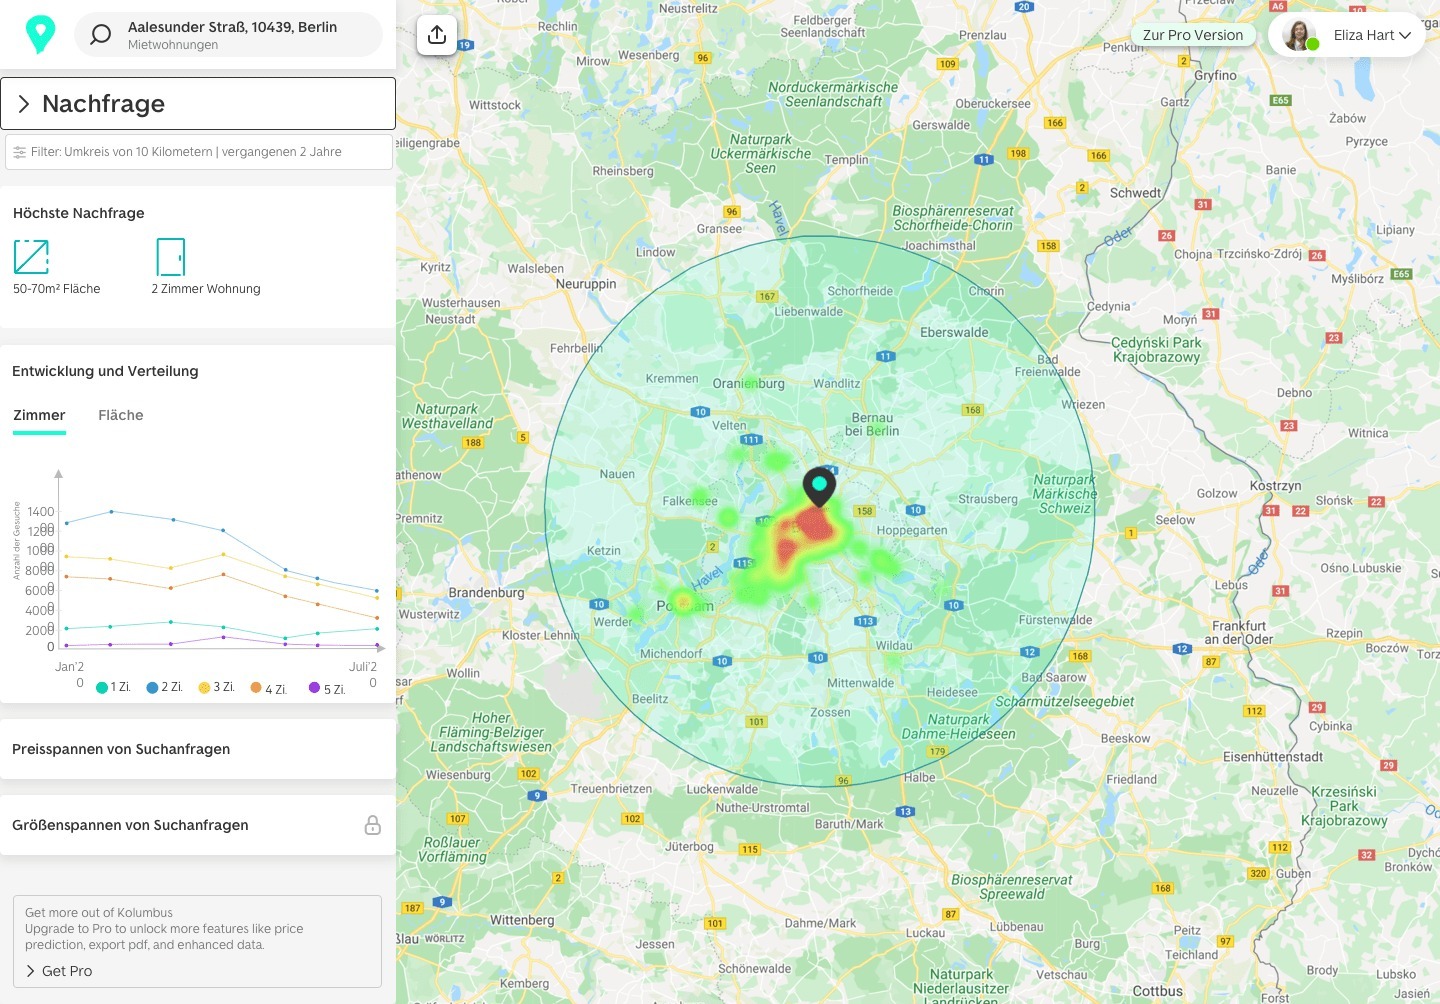
Findings & outcome
1) Orientation and Navigation – Users know where they are at any given moment in the tool and can easily switch between sections.
2) Find-ability and Usability – Users can easily find all data points and use the required functions in the tool (with a few exceptions).
3) Wording/labeling – Users understand what is meant by each section title, filter name, and so on, and their expectations are met by the displayed content (with one exception).
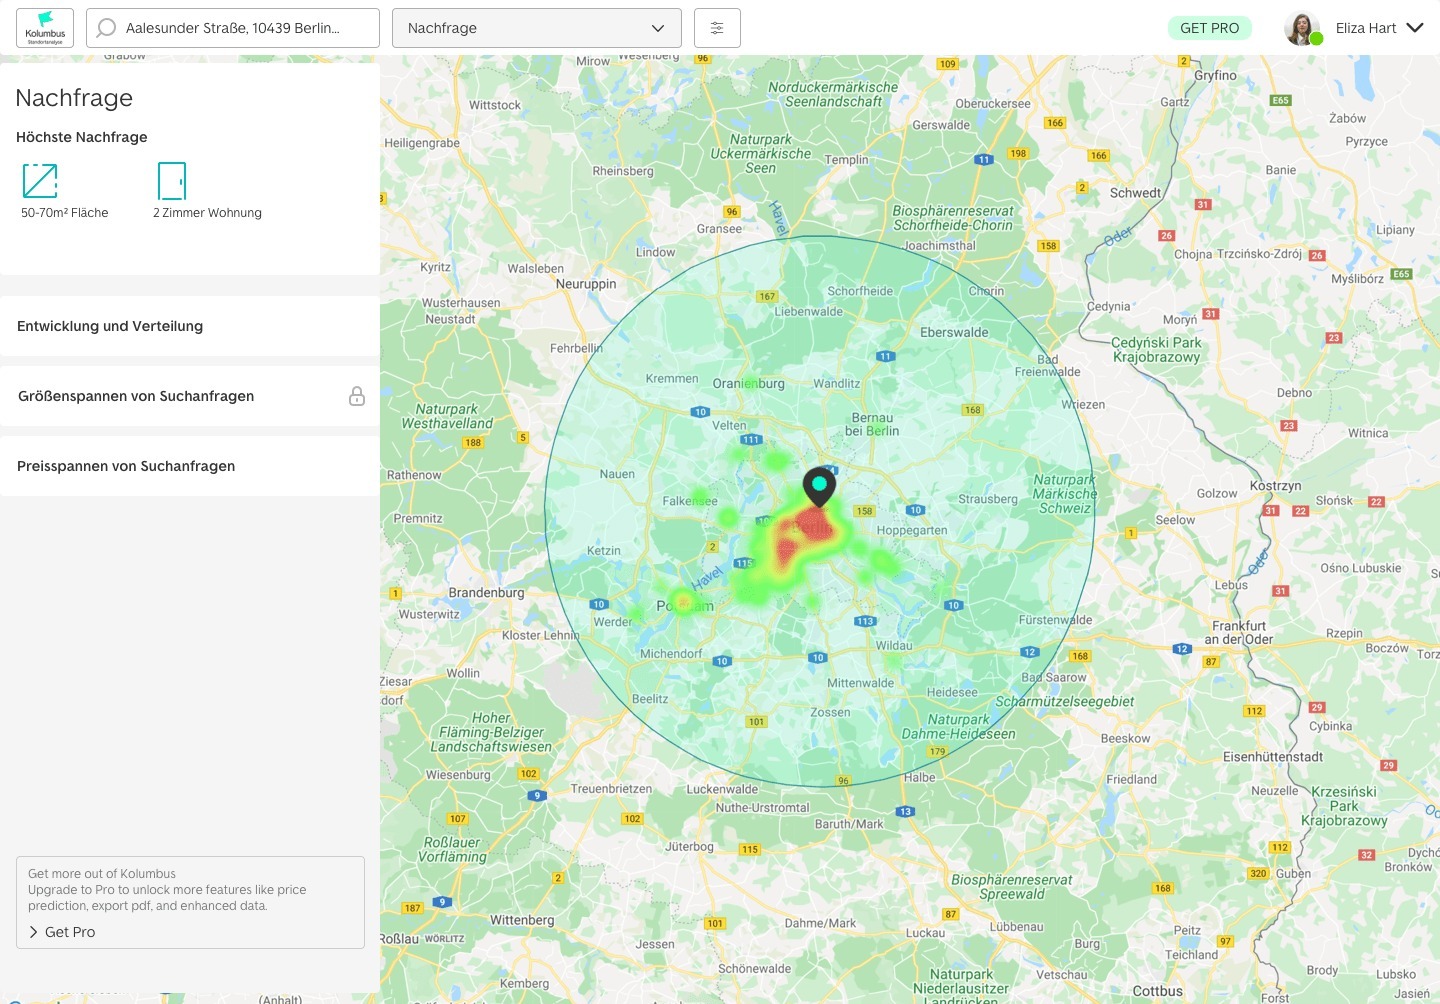
Version C was the winner in our test with an 89% task completion rate and the highest user satisfaction.